
SPECpower_ssj2008
Host 'NODE06' Performance Report
Copyright © 2007-2019 Standard Performance Evaluation Corporation
| Hewlett Packard Enterprise Synergy 480 Gen10 Compute Module | ssj_ops@100% = 5,748,113 ssj_ops@100% per JVM = 1,437,028 |
||||
| Test Sponsor: | Hewlett Packard Enterprise | SPEC License #: | 3 | Test Method: | Multi Node |
| Tested By: | Hewlett Packard Enterprise | Test Location: | Houston, TX, USA | Test Date: | Mar 26, 2019 |
| Hardware Availability: | Apr-2019 | Software Availability: | Mar-2019 | Publication: | May 8, 2019 |
| System Source: | Single Supplier | System Designation: | Server | Power Provisioning: | Line-powered |
| Target Load | Actual Load | ssj_ops | |
|---|---|---|---|
| Target | Actual | ||
| Calibration 1 | 5,767,791 | ||
| Calibration 2 | 5,762,479 | ||
| Calibration 3 | 5,768,439 | ||
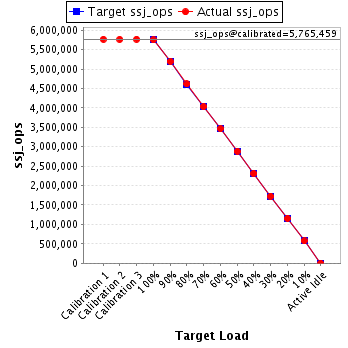
| ssj_ops@calibrated=5,765,459 | |||
| 100% | 99.7% | 5,765,459 | 5,748,113 |
| 90% | 90.1% | 5,188,913 | 5,195,571 |
| 80% | 80.0% | 4,612,367 | 4,614,542 |
| 70% | 70.0% | 4,035,821 | 4,033,115 |
| 60% | 60.0% | 3,459,275 | 3,459,948 |
| 50% | 50.0% | 2,882,729 | 2,882,427 |
| 40% | 40.0% | 2,306,184 | 2,306,711 |
| 30% | 30.0% | 1,729,638 | 1,728,135 |
| 20% | 20.0% | 1,153,092 | 1,155,423 |
| 10% | 10.0% | 576,546 | 574,331 |
| Active Idle | 0 | 0 | |
| Set Identifier: | SUT |
| Set Description: | System Under Test |
| # of Identical Nodes: | 10 |
| Comment: | SUT |
| Hardware | |
|---|---|
| Hardware Vendor: | Hewlett Packard Enterprise |
| Model: | Synergy 480 Gen10 Compute Module |
| Form Factor: | 7U |
| CPU Name: | Intel Xeon Platinum 8280 @ 2.70GHz (Intel Turbo Boost Technology up to 4.00 GHz) |
| CPU Characteristics: | 28-Core, 2.70 GHz, 38.5MB L3 Cache |
| CPU Frequency (MHz): | 2700 |
| CPU(s) Enabled: | 56 cores, 2 chips, 28 cores/chip |
| Hardware Threads: | 112 (2 / core) |
| CPU(s) Orderable: | 1,2 chips |
| Primary Cache: | 32 KB I + 32 KB D on chip per core |
| Secondary Cache: | 1 MB I+D on chip per core |
| Tertiary Cache: | 39424 KB I+D on chip per chip |
| Other Cache: | None |
| Memory Amount (GB): | 192 |
| # and size of DIMM: | 12 x 16384 MB |
| Memory Details: | 12 x 16GB 2Rx8 PC4-2933Y-R; slots 1, 3, 5, 8, 10 and 12 populated in each socket |
| Power Supply Quantity and Rating (W): | None |
| Power Supply Details: | N/A |
| Disk Drive: | 1 x HPE 240GB 6G SATA M.2 SSD (875488-B21) |
| Disk Controller: | HPE Smart Array S100i SR Gen10 |
| # and type of Network Interface Cards (NICs) Installed: | 1 x HPE Synergy 3820C 10/20Gb CNA |
| NICs Enabled in Firmware / OS / Connected: | 2/2/1 |
| Network Speed (Mbit): | 1000 |
| Keyboard: | None |
| Mouse: | None |
| Monitor: | None |
| Optical Drives: | No |
| Other Hardware: | H/S: Standard |
| Software | |
|---|---|
| Power Management: | Enabled (see SUT Notes) |
| Operating System (OS): | Windows Server 2012 R2 Datacenter |
| OS Version: | Version 6.3 (Build 9600) |
| Filesystem: | NTFS |
| JVM Vendor: | Oracle Corporation |
| JVM Version: | Oracle Java HotSpot(TM) 64-Bit Server VM (build 24.80-b11, mixed mode), version 1.7.0_80 |
| JVM Command-line Options: | -server -Xmn21000m -Xms24000m -Xmx24000m -XX:SurvivorRatio=1 -XX:TargetSurvivorRatio=99 -XX:AllocatePrefetchDistance=256 -XX:AllocatePrefetchLines=4 -XX:LoopUnrollLimit=45 -XX:InitialTenuringThreshold=12 -XX:MaxTenuringThreshold=15 -XX:ParallelGCThreads=28 -XX:InlineSmallCode=3900 -XX:MaxInlineSize=270 -XX:FreqInlineSize=2500 -XX:+AggressiveOpts -XX:+UseLargePages -XX:+UseParallelOldGC |
| JVM Affinity: | start /NODE [0,1,2,3] /AFFINITY [0xFFFFFFF] |
| JVM Instances: | 4 |
| JVM Initial Heap (MB): | 24000 |
| JVM Maximum Heap (MB): | 24000 |
| JVM Address Bits: | 64 |
| Boot Firmware Version: | I42 v2.00 (02/02/2019) |
| Management Firmware Version: | 1.40 Feb 05 2019 |
| Workload Version: | SSJ 1.2.10 |
| Director Location: | Controller |
| Other Software: | HPE Service Pack for ProLiant (SPP) Version: 2019.03.0, Microsoft Windows KB4056898, KB4338815 |
| JVM Instance | ssj_ops@100% |
|---|---|
| NODE06.001 | 1,442,185 |
| NODE06.002 | 1,430,335 |
| NODE06.003 | 1,430,177 |
| NODE06.004 | 1,445,416 |
| ssj_ops@100% | 5,748,113 |
| ssj_ops@100% per JVM | 1,437,028 |

| Target Load | Actual Load | ssj_ops | |
|---|---|---|---|
| Target | Actual | ||
| Calibration 1 | 1,444,194 | ||
| Calibration 2 | 1,444,043 | ||
| Calibration 3 | 1,448,661 | ||
| ssj_ops@calibrated=1,446,352 | |||
| 100% | 99.7% | 1,446,352 | 1,442,185 |
| 90% | 90.3% | 1,301,717 | 1,305,786 |
| 80% | 80.0% | 1,157,082 | 1,156,527 |
| 70% | 69.9% | 1,012,447 | 1,010,634 |
| 60% | 60.2% | 867,811 | 871,374 |
| 50% | 50.1% | 723,176 | 724,268 |
| 40% | 40.1% | 578,541 | 579,638 |
| 30% | 29.9% | 433,906 | 431,755 |
| 20% | 20.1% | 289,270 | 290,331 |
| 10% | 10.0% | 144,635 | 144,613 |
| Active Idle | 0 | 0 | |

| Target Load | Actual Load | ssj_ops | |
|---|---|---|---|
| Target | Actual | ||
| Calibration 1 | 1,434,996 | ||
| Calibration 2 | 1,433,797 | ||
| Calibration 3 | 1,434,427 | ||
| ssj_ops@calibrated=1,434,112 | |||
| 100% | 99.7% | 1,434,112 | 1,430,335 |
| 90% | 90.1% | 1,290,701 | 1,292,031 |
| 80% | 80.1% | 1,147,290 | 1,148,323 |
| 70% | 70.0% | 1,003,878 | 1,003,339 |
| 60% | 59.9% | 860,467 | 859,359 |
| 50% | 49.9% | 717,056 | 715,541 |
| 40% | 39.9% | 573,645 | 571,994 |
| 30% | 30.1% | 430,234 | 431,103 |
| 20% | 20.1% | 286,822 | 287,784 |
| 10% | 10.0% | 143,411 | 143,785 |
| Active Idle | 0 | 0 | |

| Target Load | Actual Load | ssj_ops | |
|---|---|---|---|
| Target | Actual | ||
| Calibration 1 | 1,435,042 | ||
| Calibration 2 | 1,433,485 | ||
| Calibration 3 | 1,435,376 | ||
| ssj_ops@calibrated=1,434,431 | |||
| 100% | 99.7% | 1,434,431 | 1,430,177 |
| 90% | 89.9% | 1,290,988 | 1,289,997 |
| 80% | 80.1% | 1,147,545 | 1,148,945 |
| 70% | 70.1% | 1,004,102 | 1,005,008 |
| 60% | 60.0% | 860,658 | 860,971 |
| 50% | 49.8% | 717,215 | 714,363 |
| 40% | 40.1% | 573,772 | 574,651 |
| 30% | 30.0% | 430,329 | 429,961 |
| 20% | 20.1% | 286,886 | 288,003 |
| 10% | 9.9% | 143,443 | 142,026 |
| Active Idle | 0 | 0 | |

| Target Load | Actual Load | ssj_ops | |
|---|---|---|---|
| Target | Actual | ||
| Calibration 1 | 1,453,559 | ||
| Calibration 2 | 1,451,154 | ||
| Calibration 3 | 1,449,974 | ||
| ssj_ops@calibrated=1,450,564 | |||
| 100% | 99.6% | 1,450,564 | 1,445,416 |
| 90% | 90.2% | 1,305,508 | 1,307,757 |
| 80% | 80.0% | 1,160,451 | 1,160,746 |
| 70% | 69.9% | 1,015,395 | 1,014,134 |
| 60% | 59.9% | 870,338 | 868,244 |
| 50% | 50.2% | 725,282 | 728,255 |
| 40% | 40.0% | 580,226 | 580,428 |
| 30% | 30.0% | 435,169 | 435,316 |
| 20% | 19.9% | 290,113 | 289,306 |
| 10% | 9.9% | 145,056 | 143,908 |
| Active Idle | 0 | 0 | |
