SPECpower_ssj2008
Host 'NODE07' Performance Report
Copyright © 2007-2019 Standard Performance Evaluation Corporation
| Hewlett Packard Enterprise Synergy 480 Gen10 Compute Module | ssj_ops@100% = 5,743,581 ssj_ops@100% per JVM = 1,435,895 |
||||
| Test Sponsor: | Hewlett Packard Enterprise | SPEC License #: | 3 | Test Method: | Multi Node |
| Tested By: | Hewlett Packard Enterprise | Test Location: | Houston, TX, USA | Test Date: | Mar 26, 2019 |
| Hardware Availability: | Apr-2019 | Software Availability: | Mar-2019 | Publication: | May 8, 2019 |
| System Source: | Single Supplier | System Designation: | Server | Power Provisioning: | Line-powered |
| Target Load | Actual Load | ssj_ops | |
|---|---|---|---|
| Target | Actual | ||
| Calibration 1 | 5,766,564 | ||
| Calibration 2 | 5,756,169 | ||
| Calibration 3 | 5,761,111 | ||
| ssj_ops@calibrated=5,758,640 | |||
| 100% | 99.7% | 5,758,640 | 5,743,581 |
| 90% | 90.0% | 5,182,776 | 5,182,202 |
| 80% | 79.9% | 4,606,912 | 4,603,686 |
| 70% | 69.9% | 4,031,048 | 4,027,303 |
| 60% | 60.0% | 3,455,184 | 3,453,271 |
| 50% | 49.9% | 2,879,320 | 2,874,865 |
| 40% | 40.0% | 2,303,456 | 2,303,985 |
| 30% | 30.0% | 1,727,592 | 1,727,865 |
| 20% | 20.0% | 1,151,728 | 1,151,343 |
| 10% | 10.0% | 575,864 | 576,704 |
| Active Idle | 0 | 0 | |

| Set Identifier: | SUT |
| Set Description: | System Under Test |
| # of Identical Nodes: | 10 |
| Comment: | SUT |
| Hardware | |
|---|---|
| Hardware Vendor: | Hewlett Packard Enterprise |
| Model: | Synergy 480 Gen10 Compute Module |
| Form Factor: | 7U |
| CPU Name: | Intel Xeon Platinum 8280 @ 2.70GHz (Intel Turbo Boost Technology up to 4.00 GHz) |
| CPU Characteristics: | 28-Core, 2.70 GHz, 38.5MB L3 Cache |
| CPU Frequency (MHz): | 2700 |
| CPU(s) Enabled: | 56 cores, 2 chips, 28 cores/chip |
| Hardware Threads: | 112 (2 / core) |
| CPU(s) Orderable: | 1,2 chips |
| Primary Cache: | 32 KB I + 32 KB D on chip per core |
| Secondary Cache: | 1 MB I+D on chip per core |
| Tertiary Cache: | 39424 KB I+D on chip per chip |
| Other Cache: | None |
| Memory Amount (GB): | 192 |
| # and size of DIMM: | 12 x 16384 MB |
| Memory Details: | 12 x 16GB 2Rx8 PC4-2933Y-R; slots 1, 3, 5, 8, 10 and 12 populated in each socket |
| Power Supply Quantity and Rating (W): | None |
| Power Supply Details: | N/A |
| Disk Drive: | 1 x HPE 240GB 6G SATA M.2 SSD (875488-B21) |
| Disk Controller: | HPE Smart Array S100i SR Gen10 |
| # and type of Network Interface Cards (NICs) Installed: | 1 x HPE Synergy 3820C 10/20Gb CNA |
| NICs Enabled in Firmware / OS / Connected: | 2/2/1 |
| Network Speed (Mbit): | 1000 |
| Keyboard: | None |
| Mouse: | None |
| Monitor: | None |
| Optical Drives: | No |
| Other Hardware: | H/S: Standard |
| Software | |
|---|---|
| Power Management: | Enabled (see SUT Notes) |
| Operating System (OS): | Windows Server 2012 R2 Datacenter |
| OS Version: | Version 6.3 (Build 9600) |
| Filesystem: | NTFS |
| JVM Vendor: | Oracle Corporation |
| JVM Version: | Oracle Java HotSpot(TM) 64-Bit Server VM (build 24.80-b11, mixed mode), version 1.7.0_80 |
| JVM Command-line Options: | -server -Xmn21000m -Xms24000m -Xmx24000m -XX:SurvivorRatio=1 -XX:TargetSurvivorRatio=99 -XX:AllocatePrefetchDistance=256 -XX:AllocatePrefetchLines=4 -XX:LoopUnrollLimit=45 -XX:InitialTenuringThreshold=12 -XX:MaxTenuringThreshold=15 -XX:ParallelGCThreads=28 -XX:InlineSmallCode=3900 -XX:MaxInlineSize=270 -XX:FreqInlineSize=2500 -XX:+AggressiveOpts -XX:+UseLargePages -XX:+UseParallelOldGC |
| JVM Affinity: | start /NODE [0,1,2,3] /AFFINITY [0xFFFFFFF] |
| JVM Instances: | 4 |
| JVM Initial Heap (MB): | 24000 |
| JVM Maximum Heap (MB): | 24000 |
| JVM Address Bits: | 64 |
| Boot Firmware Version: | I42 v2.00 (02/02/2019) |
| Management Firmware Version: | 1.40 Feb 05 2019 |
| Workload Version: | SSJ 1.2.10 |
| Director Location: | Controller |
| Other Software: | HPE Service Pack for ProLiant (SPP) Version: 2019.03.0, Microsoft Windows KB4056898, KB4338815 |
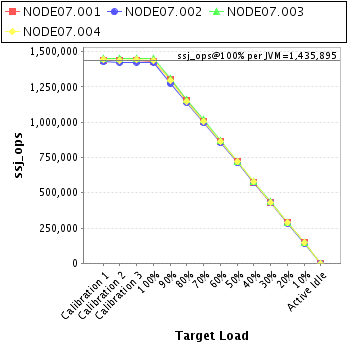
| JVM Instance | ssj_ops@100% |
|---|---|
| NODE07.001 | 1,432,623 |
| NODE07.002 | 1,423,188 |
| NODE07.003 | 1,451,000 |
| NODE07.004 | 1,436,771 |
| ssj_ops@100% | 5,743,581 |
| ssj_ops@100% per JVM | 1,435,895 |
| Target Load | Actual Load | ssj_ops | |
|---|---|---|---|
| Target | Actual | ||
| Calibration 1 | 1,439,610 | ||
| Calibration 2 | 1,436,144 | ||
| Calibration 3 | 1,439,686 | ||
| ssj_ops@calibrated=1,437,915 | |||
| 100% | 99.6% | 1,437,915 | 1,432,623 |
| 90% | 90.5% | 1,294,123 | 1,301,061 |
| 80% | 80.1% | 1,150,332 | 1,152,416 |
| 70% | 70.0% | 1,006,540 | 1,006,331 |
| 60% | 60.0% | 862,749 | 862,921 |
| 50% | 50.0% | 718,957 | 719,321 |
| 40% | 39.9% | 575,166 | 573,598 |
| 30% | 30.1% | 431,374 | 433,174 |
| 20% | 19.9% | 287,583 | 286,200 |
| 10% | 10.0% | 143,791 | 143,750 |
| Active Idle | 0 | 0 | |

| Target Load | Actual Load | ssj_ops | |
|---|---|---|---|
| Target | Actual | ||
| Calibration 1 | 1,429,382 | ||
| Calibration 2 | 1,425,381 | ||
| Calibration 3 | 1,427,248 | ||
| ssj_ops@calibrated=1,426,314 | |||
| 100% | 99.8% | 1,426,314 | 1,423,188 |
| 90% | 89.6% | 1,283,683 | 1,277,640 |
| 80% | 79.9% | 1,141,051 | 1,139,186 |
| 70% | 69.8% | 998,420 | 995,553 |
| 60% | 59.9% | 855,789 | 854,172 |
| 50% | 49.9% | 713,157 | 712,277 |
| 40% | 40.1% | 570,526 | 571,354 |
| 30% | 30.0% | 427,894 | 427,715 |
| 20% | 20.0% | 285,263 | 285,026 |
| 10% | 10.0% | 142,631 | 142,318 |
| Active Idle | 0 | 0 | |

| Target Load | Actual Load | ssj_ops | |
|---|---|---|---|
| Target | Actual | ||
| Calibration 1 | 1,454,318 | ||
| Calibration 2 | 1,454,358 | ||
| Calibration 3 | 1,452,678 | ||
| ssj_ops@calibrated=1,453,518 | |||
| 100% | 99.8% | 1,453,518 | 1,451,000 |
| 90% | 90.0% | 1,308,166 | 1,307,754 |
| 80% | 79.9% | 1,162,814 | 1,161,820 |
| 70% | 69.9% | 1,017,463 | 1,016,659 |
| 60% | 60.0% | 872,111 | 872,156 |
| 50% | 49.7% | 726,759 | 723,071 |
| 40% | 40.1% | 581,407 | 582,371 |
| 30% | 29.9% | 436,055 | 434,531 |
| 20% | 20.1% | 290,704 | 291,887 |
| 10% | 10.1% | 145,352 | 146,295 |
| Active Idle | 0 | 0 | |

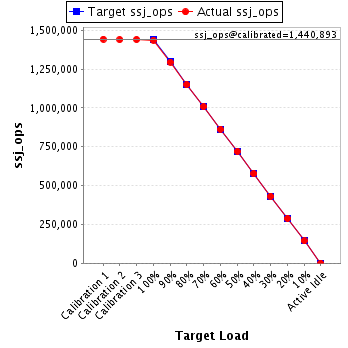
| Target Load | Actual Load | ssj_ops | |
|---|---|---|---|
| Target | Actual | ||
| Calibration 1 | 1,443,255 | ||
| Calibration 2 | 1,440,287 | ||
| Calibration 3 | 1,441,498 | ||
| ssj_ops@calibrated=1,440,893 | |||
| 100% | 99.7% | 1,440,893 | 1,436,771 |
| 90% | 89.9% | 1,296,803 | 1,295,748 |
| 80% | 79.8% | 1,152,714 | 1,150,264 |
| 70% | 70.0% | 1,008,625 | 1,008,760 |
| 60% | 60.0% | 864,536 | 864,022 |
| 50% | 50.0% | 720,446 | 720,195 |
| 40% | 40.0% | 576,357 | 576,663 |
| 30% | 30.0% | 432,268 | 432,444 |
| 20% | 20.0% | 288,179 | 288,230 |
| 10% | 10.0% | 144,089 | 144,341 |
| Active Idle | 0 | 0 | |