SPECpower_ssj2008
Host 'NODE08' Performance Report
Copyright © 2007-2019 Standard Performance Evaluation Corporation
| Hewlett Packard Enterprise Synergy 480 Gen10 Compute Module | ssj_ops@100% = 5,733,050 ssj_ops@100% per JVM = 1,433,262 |
||||
| Test Sponsor: | Hewlett Packard Enterprise | SPEC License #: | 3 | Test Method: | Multi Node |
| Tested By: | Hewlett Packard Enterprise | Test Location: | Houston, TX, USA | Test Date: | Mar 26, 2019 |
| Hardware Availability: | Apr-2019 | Software Availability: | Mar-2019 | Publication: | May 8, 2019 |
| System Source: | Single Supplier | System Designation: | Server | Power Provisioning: | Line-powered |
| Target Load | Actual Load | ssj_ops | |
|---|---|---|---|
| Target | Actual | ||
| Calibration 1 | 5,747,044 | ||
| Calibration 2 | 5,745,687 | ||
| Calibration 3 | 5,756,708 | ||
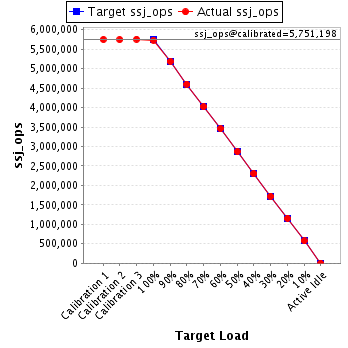
| ssj_ops@calibrated=5,751,198 | |||
| 100% | 99.7% | 5,751,198 | 5,733,050 |
| 90% | 90.1% | 5,176,078 | 5,184,699 |
| 80% | 80.0% | 4,600,958 | 4,600,995 |
| 70% | 69.9% | 4,025,838 | 4,021,577 |
| 60% | 60.1% | 3,450,719 | 3,456,319 |
| 50% | 49.9% | 2,875,599 | 2,868,055 |
| 40% | 40.0% | 2,300,479 | 2,300,670 |
| 30% | 30.0% | 1,725,359 | 1,722,553 |
| 20% | 20.1% | 1,150,240 | 1,154,901 |
| 10% | 10.0% | 575,120 | 574,825 |
| Active Idle | 0 | 0 | |
| Set Identifier: | SUT |
| Set Description: | System Under Test |
| # of Identical Nodes: | 10 |
| Comment: | SUT |
| Hardware | |
|---|---|
| Hardware Vendor: | Hewlett Packard Enterprise |
| Model: | Synergy 480 Gen10 Compute Module |
| Form Factor: | 7U |
| CPU Name: | Intel Xeon Platinum 8280 @ 2.70GHz (Intel Turbo Boost Technology up to 4.00 GHz) |
| CPU Characteristics: | 28-Core, 2.70 GHz, 38.5MB L3 Cache |
| CPU Frequency (MHz): | 2700 |
| CPU(s) Enabled: | 56 cores, 2 chips, 28 cores/chip |
| Hardware Threads: | 112 (2 / core) |
| CPU(s) Orderable: | 1,2 chips |
| Primary Cache: | 32 KB I + 32 KB D on chip per core |
| Secondary Cache: | 1 MB I+D on chip per core |
| Tertiary Cache: | 39424 KB I+D on chip per chip |
| Other Cache: | None |
| Memory Amount (GB): | 192 |
| # and size of DIMM: | 12 x 16384 MB |
| Memory Details: | 12 x 16GB 2Rx8 PC4-2933Y-R; slots 1, 3, 5, 8, 10 and 12 populated in each socket |
| Power Supply Quantity and Rating (W): | None |
| Power Supply Details: | N/A |
| Disk Drive: | 1 x HPE 240GB 6G SATA M.2 SSD (875488-B21) |
| Disk Controller: | HPE Smart Array S100i SR Gen10 |
| # and type of Network Interface Cards (NICs) Installed: | 1 x HPE Synergy 3820C 10/20Gb CNA |
| NICs Enabled in Firmware / OS / Connected: | 2/2/1 |
| Network Speed (Mbit): | 1000 |
| Keyboard: | None |
| Mouse: | None |
| Monitor: | None |
| Optical Drives: | No |
| Other Hardware: | H/S: Standard |
| Software | |
|---|---|
| Power Management: | Enabled (see SUT Notes) |
| Operating System (OS): | Windows Server 2012 R2 Datacenter |
| OS Version: | Version 6.3 (Build 9600) |
| Filesystem: | NTFS |
| JVM Vendor: | Oracle Corporation |
| JVM Version: | Oracle Java HotSpot(TM) 64-Bit Server VM (build 24.80-b11, mixed mode), version 1.7.0_80 |
| JVM Command-line Options: | -server -Xmn21000m -Xms24000m -Xmx24000m -XX:SurvivorRatio=1 -XX:TargetSurvivorRatio=99 -XX:AllocatePrefetchDistance=256 -XX:AllocatePrefetchLines=4 -XX:LoopUnrollLimit=45 -XX:InitialTenuringThreshold=12 -XX:MaxTenuringThreshold=15 -XX:ParallelGCThreads=28 -XX:InlineSmallCode=3900 -XX:MaxInlineSize=270 -XX:FreqInlineSize=2500 -XX:+AggressiveOpts -XX:+UseLargePages -XX:+UseParallelOldGC |
| JVM Affinity: | start /NODE [0,1,2,3] /AFFINITY [0xFFFFFFF] |
| JVM Instances: | 4 |
| JVM Initial Heap (MB): | 24000 |
| JVM Maximum Heap (MB): | 24000 |
| JVM Address Bits: | 64 |
| Boot Firmware Version: | I42 v2.00 (02/02/2019) |
| Management Firmware Version: | 1.40 Feb 05 2019 |
| Workload Version: | SSJ 1.2.10 |
| Director Location: | Controller |
| Other Software: | HPE Service Pack for ProLiant (SPP) Version: 2019.03.0, Microsoft Windows KB4056898, KB4338815 |
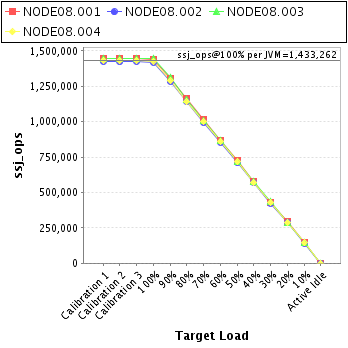
| JVM Instance | ssj_ops@100% |
|---|---|
| NODE08.001 | 1,440,930 |
| NODE08.002 | 1,418,583 |
| NODE08.003 | 1,445,199 |
| NODE08.004 | 1,428,337 |
| ssj_ops@100% | 5,733,050 |
| ssj_ops@100% per JVM | 1,433,262 |
| Target Load | Actual Load | ssj_ops | |
|---|---|---|---|
| Target | Actual | ||
| Calibration 1 | 1,443,350 | ||
| Calibration 2 | 1,444,916 | ||
| Calibration 3 | 1,448,432 | ||
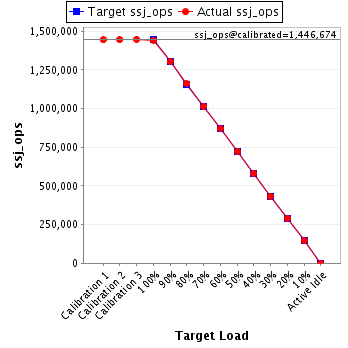
| ssj_ops@calibrated=1,446,674 | |||
| 100% | 99.6% | 1,446,674 | 1,440,930 |
| 90% | 90.1% | 1,302,007 | 1,302,959 |
| 80% | 80.2% | 1,157,339 | 1,160,630 |
| 70% | 70.2% | 1,012,672 | 1,016,248 |
| 60% | 60.1% | 868,004 | 869,383 |
| 50% | 50.0% | 723,337 | 723,060 |
| 40% | 40.1% | 578,670 | 579,903 |
| 30% | 29.9% | 434,002 | 432,181 |
| 20% | 20.1% | 289,335 | 291,498 |
| 10% | 9.9% | 144,667 | 143,909 |
| Active Idle | 0 | 0 | |
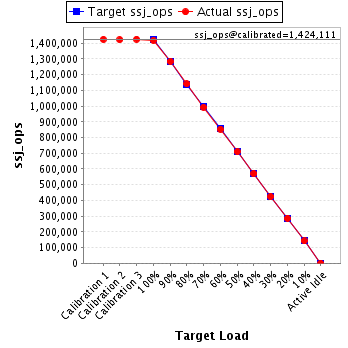
| Target Load | Actual Load | ssj_ops | |
|---|---|---|---|
| Target | Actual | ||
| Calibration 1 | 1,424,953 | ||
| Calibration 2 | 1,422,121 | ||
| Calibration 3 | 1,426,101 | ||
| ssj_ops@calibrated=1,424,111 | |||
| 100% | 99.6% | 1,424,111 | 1,418,583 |
| 90% | 90.2% | 1,281,700 | 1,284,441 |
| 80% | 80.2% | 1,139,289 | 1,141,891 |
| 70% | 69.8% | 996,878 | 993,673 |
| 60% | 60.0% | 854,467 | 853,956 |
| 50% | 49.8% | 712,055 | 709,615 |
| 40% | 40.0% | 569,644 | 569,512 |
| 30% | 29.7% | 427,233 | 423,338 |
| 20% | 20.1% | 284,822 | 286,690 |
| 10% | 10.0% | 142,411 | 141,861 |
| Active Idle | 0 | 0 | |
| Target Load | Actual Load | ssj_ops | |
|---|---|---|---|
| Target | Actual | ||
| Calibration 1 | 1,446,582 | ||
| Calibration 2 | 1,447,765 | ||
| Calibration 3 | 1,448,617 | ||
| ssj_ops@calibrated=1,448,191 | |||
| 100% | 99.8% | 1,448,191 | 1,445,199 |
| 90% | 90.4% | 1,303,372 | 1,308,664 |
| 80% | 79.9% | 1,158,553 | 1,157,070 |
| 70% | 69.7% | 1,013,734 | 1,009,287 |
| 60% | 60.1% | 868,915 | 870,632 |
| 50% | 49.7% | 724,096 | 719,532 |
| 40% | 40.1% | 579,277 | 580,132 |
| 30% | 30.1% | 434,457 | 436,247 |
| 20% | 20.0% | 289,638 | 289,245 |
| 10% | 10.0% | 144,819 | 144,997 |
| Active Idle | 0 | 0 | |

| Target Load | Actual Load | ssj_ops | |
|---|---|---|---|
| Target | Actual | ||
| Calibration 1 | 1,432,159 | ||
| Calibration 2 | 1,430,884 | ||
| Calibration 3 | 1,433,558 | ||
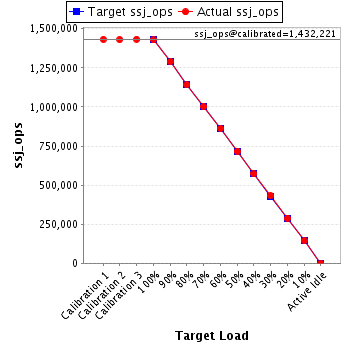
| ssj_ops@calibrated=1,432,221 | |||
| 100% | 99.7% | 1,432,221 | 1,428,337 |
| 90% | 90.0% | 1,288,999 | 1,288,635 |
| 80% | 79.7% | 1,145,777 | 1,141,404 |
| 70% | 70.0% | 1,002,555 | 1,002,369 |
| 60% | 60.2% | 859,333 | 862,348 |
| 50% | 50.0% | 716,111 | 715,848 |
| 40% | 39.9% | 572,889 | 571,123 |
| 30% | 30.1% | 429,666 | 430,788 |
| 20% | 20.1% | 286,444 | 287,468 |
| 10% | 10.1% | 143,222 | 144,058 |
| Active Idle | 0 | 0 | |