SPECpower_ssj2008
Host 'NODE10' Performance Report
Copyright © 2007-2019 Standard Performance Evaluation Corporation
| Hewlett Packard Enterprise Synergy 480 Gen10 Compute Module | ssj_ops@100% = 5,749,842 ssj_ops@100% per JVM = 1,437,460 |
||||
| Test Sponsor: | Hewlett Packard Enterprise | SPEC License #: | 3 | Test Method: | Multi Node |
| Tested By: | Hewlett Packard Enterprise | Test Location: | Houston, TX, USA | Test Date: | Mar 26, 2019 |
| Hardware Availability: | Apr-2019 | Software Availability: | Mar-2019 | Publication: | May 8, 2019 |
| System Source: | Single Supplier | System Designation: | Server | Power Provisioning: | Line-powered |
| Target Load | Actual Load | ssj_ops | |
|---|---|---|---|
| Target | Actual | ||
| Calibration 1 | 5,761,518 | ||
| Calibration 2 | 5,757,756 | ||
| Calibration 3 | 5,768,565 | ||
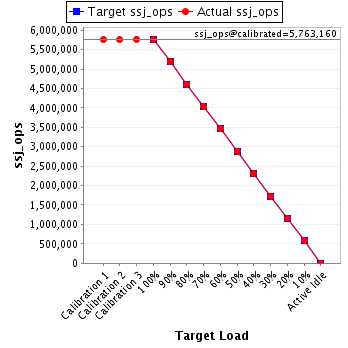
| ssj_ops@calibrated=5,763,160 | |||
| 100% | 99.8% | 5,763,160 | 5,749,842 |
| 90% | 89.9% | 5,186,844 | 5,183,681 |
| 80% | 80.0% | 4,610,528 | 4,610,443 |
| 70% | 70.0% | 4,034,212 | 4,036,696 |
| 60% | 60.1% | 3,457,896 | 3,462,766 |
| 50% | 50.0% | 2,881,580 | 2,882,149 |
| 40% | 40.0% | 2,305,264 | 2,304,690 |
| 30% | 30.0% | 1,728,948 | 1,726,372 |
| 20% | 20.0% | 1,152,632 | 1,154,495 |
| 10% | 10.1% | 576,316 | 583,242 |
| Active Idle | 0 | 0 | |
| Set Identifier: | SUT |
| Set Description: | System Under Test |
| # of Identical Nodes: | 10 |
| Comment: | SUT |
| Hardware | |
|---|---|
| Hardware Vendor: | Hewlett Packard Enterprise |
| Model: | Synergy 480 Gen10 Compute Module |
| Form Factor: | 7U |
| CPU Name: | Intel Xeon Platinum 8280 @ 2.70GHz (Intel Turbo Boost Technology up to 4.00 GHz) |
| CPU Characteristics: | 28-Core, 2.70 GHz, 38.5MB L3 Cache |
| CPU Frequency (MHz): | 2700 |
| CPU(s) Enabled: | 56 cores, 2 chips, 28 cores/chip |
| Hardware Threads: | 112 (2 / core) |
| CPU(s) Orderable: | 1,2 chips |
| Primary Cache: | 32 KB I + 32 KB D on chip per core |
| Secondary Cache: | 1 MB I+D on chip per core |
| Tertiary Cache: | 39424 KB I+D on chip per chip |
| Other Cache: | None |
| Memory Amount (GB): | 192 |
| # and size of DIMM: | 12 x 16384 MB |
| Memory Details: | 12 x 16GB 2Rx8 PC4-2933Y-R; slots 1, 3, 5, 8, 10 and 12 populated in each socket |
| Power Supply Quantity and Rating (W): | None |
| Power Supply Details: | N/A |
| Disk Drive: | 1 x HPE 240GB 6G SATA M.2 SSD (875488-B21) |
| Disk Controller: | HPE Smart Array S100i SR Gen10 |
| # and type of Network Interface Cards (NICs) Installed: | 1 x HPE Synergy 3820C 10/20Gb CNA |
| NICs Enabled in Firmware / OS / Connected: | 2/2/1 |
| Network Speed (Mbit): | 1000 |
| Keyboard: | None |
| Mouse: | None |
| Monitor: | None |
| Optical Drives: | No |
| Other Hardware: | H/S: Standard |
| Software | |
|---|---|
| Power Management: | Enabled (see SUT Notes) |
| Operating System (OS): | Windows Server 2012 R2 Datacenter |
| OS Version: | Version 6.3 (Build 9600) |
| Filesystem: | NTFS |
| JVM Vendor: | Oracle Corporation |
| JVM Version: | Oracle Java HotSpot(TM) 64-Bit Server VM (build 24.80-b11, mixed mode), version 1.7.0_80 |
| JVM Command-line Options: | -server -Xmn21000m -Xms24000m -Xmx24000m -XX:SurvivorRatio=1 -XX:TargetSurvivorRatio=99 -XX:AllocatePrefetchDistance=256 -XX:AllocatePrefetchLines=4 -XX:LoopUnrollLimit=45 -XX:InitialTenuringThreshold=12 -XX:MaxTenuringThreshold=15 -XX:ParallelGCThreads=28 -XX:InlineSmallCode=3900 -XX:MaxInlineSize=270 -XX:FreqInlineSize=2500 -XX:+AggressiveOpts -XX:+UseLargePages -XX:+UseParallelOldGC |
| JVM Affinity: | start /NODE [0,1,2,3] /AFFINITY [0xFFFFFFF] |
| JVM Instances: | 4 |
| JVM Initial Heap (MB): | 24000 |
| JVM Maximum Heap (MB): | 24000 |
| JVM Address Bits: | 64 |
| Boot Firmware Version: | I42 v2.00 (02/02/2019) |
| Management Firmware Version: | 1.40 Feb 05 2019 |
| Workload Version: | SSJ 1.2.10 |
| Director Location: | Controller |
| Other Software: | HPE Service Pack for ProLiant (SPP) Version: 2019.03.0, Microsoft Windows KB4056898, KB4338815 |
| JVM Instance | ssj_ops@100% |
|---|---|
| NODE10.001 | 1,433,575 |
| NODE10.002 | 1,435,222 |
| NODE10.003 | 1,431,412 |
| NODE10.004 | 1,449,633 |
| ssj_ops@100% | 5,749,842 |
| ssj_ops@100% per JVM | 1,437,460 |

| Target Load | Actual Load | ssj_ops | |
|---|---|---|---|
| Target | Actual | ||
| Calibration 1 | 1,439,118 | ||
| Calibration 2 | 1,437,181 | ||
| Calibration 3 | 1,440,879 | ||
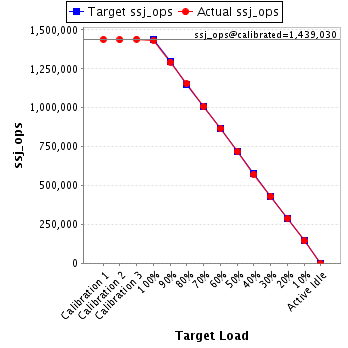
| ssj_ops@calibrated=1,439,030 | |||
| 100% | 99.6% | 1,439,030 | 1,433,575 |
| 90% | 89.9% | 1,295,127 | 1,293,811 |
| 80% | 80.3% | 1,151,224 | 1,154,984 |
| 70% | 70.1% | 1,007,321 | 1,008,189 |
| 60% | 60.3% | 863,418 | 867,450 |
| 50% | 50.0% | 719,515 | 719,789 |
| 40% | 39.8% | 575,612 | 572,446 |
| 30% | 29.9% | 431,709 | 430,498 |
| 20% | 20.0% | 287,806 | 287,448 |
| 10% | 10.0% | 143,903 | 143,785 |
| Active Idle | 0 | 0 | |
| Target Load | Actual Load | ssj_ops | |
|---|---|---|---|
| Target | Actual | ||
| Calibration 1 | 1,438,093 | ||
| Calibration 2 | 1,436,553 | ||
| Calibration 3 | 1,436,635 | ||
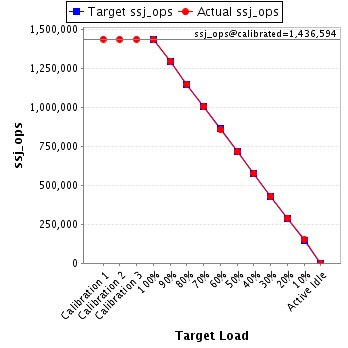
| ssj_ops@calibrated=1,436,594 | |||
| 100% | 99.9% | 1,436,594 | 1,435,222 |
| 90% | 90.1% | 1,292,935 | 1,294,626 |
| 80% | 80.1% | 1,149,275 | 1,150,234 |
| 70% | 69.9% | 1,005,616 | 1,003,968 |
| 60% | 59.9% | 861,956 | 860,996 |
| 50% | 49.9% | 718,297 | 717,093 |
| 40% | 40.2% | 574,638 | 576,800 |
| 30% | 30.0% | 430,978 | 430,611 |
| 20% | 20.2% | 287,319 | 289,781 |
| 10% | 10.6% | 143,659 | 151,701 |
| Active Idle | 0 | 0 | |
| Target Load | Actual Load | ssj_ops | |
|---|---|---|---|
| Target | Actual | ||
| Calibration 1 | 1,433,084 | ||
| Calibration 2 | 1,431,827 | ||
| Calibration 3 | 1,436,713 | ||
| ssj_ops@calibrated=1,434,270 | |||
| 100% | 99.8% | 1,434,270 | 1,431,412 |
| 90% | 89.7% | 1,290,843 | 1,286,869 |
| 80% | 79.7% | 1,147,416 | 1,143,213 |
| 70% | 70.2% | 1,003,989 | 1,006,795 |
| 60% | 60.0% | 860,562 | 860,008 |
| 50% | 50.1% | 717,135 | 718,789 |
| 40% | 40.1% | 573,708 | 575,377 |
| 30% | 29.9% | 430,281 | 428,790 |
| 20% | 20.0% | 286,854 | 286,653 |
| 10% | 10.0% | 143,427 | 142,862 |
| Active Idle | 0 | 0 | |

| Target Load | Actual Load | ssj_ops | |
|---|---|---|---|
| Target | Actual | ||
| Calibration 1 | 1,451,223 | ||
| Calibration 2 | 1,452,195 | ||
| Calibration 3 | 1,454,338 | ||
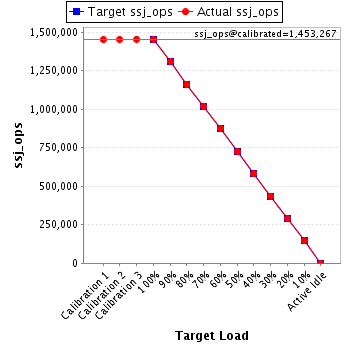
| ssj_ops@calibrated=1,453,267 | |||
| 100% | 99.7% | 1,453,267 | 1,449,633 |
| 90% | 90.0% | 1,307,940 | 1,308,376 |
| 80% | 80.0% | 1,162,613 | 1,162,012 |
| 70% | 70.0% | 1,017,287 | 1,017,744 |
| 60% | 60.2% | 871,960 | 874,312 |
| 50% | 50.0% | 726,633 | 726,478 |
| 40% | 39.9% | 581,307 | 580,068 |
| 30% | 30.0% | 435,980 | 436,474 |
| 20% | 20.0% | 290,653 | 290,613 |
| 10% | 10.0% | 145,327 | 144,894 |
| Active Idle | 0 | 0 | |