SPECpower_ssj2008
Host 'NODE02' Performance Report
Copyright © 2007-2019 Standard Performance Evaluation Corporation
| Hewlett Packard Enterprise Synergy 480 Gen10 Compute Module | ssj_ops@100% = 5,758,409 ssj_ops@100% per JVM = 1,439,602 |
||||
| Test Sponsor: | Hewlett Packard Enterprise | SPEC License #: | 3 | Test Method: | Multi Node |
| Tested By: | Hewlett Packard Enterprise | Test Location: | Houston, TX, USA | Test Date: | Mar 26, 2019 |
| Hardware Availability: | Apr-2019 | Software Availability: | Mar-2019 | Publication: | May 8, 2019 |
| System Source: | Single Supplier | System Designation: | Server | Power Provisioning: | Line-powered |
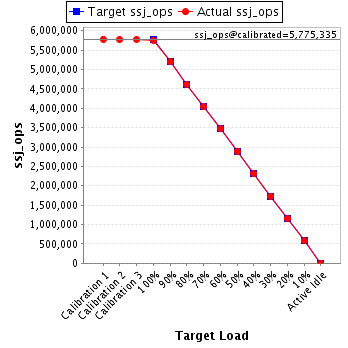
| Target Load | Actual Load | ssj_ops | |
|---|---|---|---|
| Target | Actual | ||
| Calibration 1 | 5,782,756 | ||
| Calibration 2 | 5,775,228 | ||
| Calibration 3 | 5,775,442 | ||
| ssj_ops@calibrated=5,775,335 | |||
| 100% | 99.7% | 5,775,335 | 5,758,409 |
| 90% | 90.1% | 5,197,801 | 5,201,209 |
| 80% | 80.0% | 4,620,268 | 4,619,874 |
| 70% | 70.0% | 4,042,734 | 4,044,780 |
| 60% | 60.0% | 3,465,201 | 3,467,579 |
| 50% | 50.0% | 2,887,667 | 2,884,948 |
| 40% | 39.9% | 2,310,134 | 2,303,942 |
| 30% | 30.0% | 1,732,600 | 1,732,438 |
| 20% | 20.0% | 1,155,067 | 1,153,867 |
| 10% | 10.0% | 577,533 | 577,789 |
| Active Idle | 0 | 0 | |
| Set Identifier: | SUT |
| Set Description: | System Under Test |
| # of Identical Nodes: | 9 |
| Comment: | SUT |
| Hardware | |
|---|---|
| Hardware Vendor: | Hewlett Packard Enterprise |
| Model: | Synergy 480 Gen10 Compute Module |
| Form Factor: | 7U |
| CPU Name: | Intel Xeon Platinum 8280 @ 2.70GHz (Intel Turbo Boost Technology up to 4.00 GHz) |
| CPU Characteristics: | 28-Core, 2.70 GHz, 38.5MB L3 Cache |
| CPU Frequency (MHz): | 2700 |
| CPU(s) Enabled: | 56 cores, 2 chips, 28 cores/chip |
| Hardware Threads: | 112 (2 / core) |
| CPU(s) Orderable: | 1,2 chips |
| Primary Cache: | 32 KB I + 32 KB D on chip per core |
| Secondary Cache: | 1 MB I+D on chip per core |
| Tertiary Cache: | 39424 KB I+D on chip per chip |
| Other Cache: | None |
| Memory Amount (GB): | 192 |
| # and size of DIMM: | 12 x 16384 MB |
| Memory Details: | 12 x 16GB 2Rx8 PC4-2933Y-R; slots 1, 3, 5, 8, 10 and 12 populated in each socket |
| Power Supply Quantity and Rating (W): | None |
| Power Supply Details: | N/A |
| Disk Drive: | 1 x HPE 240GB 6G SATA M.2 SSD (875488-B21) |
| Disk Controller: | HPE Smart Array S100i SR Gen10 |
| # and type of Network Interface Cards (NICs) Installed: | 1 x HPE Synergy 3820C 10/20Gb CNA |
| NICs Enabled in Firmware / OS / Connected: | 2/2/1 |
| Network Speed (Mbit): | 1000 |
| Keyboard: | None |
| Mouse: | None |
| Monitor: | None |
| Optical Drives: | No |
| Other Hardware: | H/S: Standard |
| Software | |
|---|---|
| Power Management: | Enabled (see SUT Notes) |
| Operating System (OS): | Windows Server 2012 R2 Datacenter |
| OS Version: | Version 6.3 (Build 9600) |
| Filesystem: | NTFS |
| JVM Vendor: | Oracle Corporation |
| JVM Version: | Oracle Java HotSpot(TM) 64-Bit Server VM (build 24.80-b11, mixed mode), version 1.7.0_80 |
| JVM Command-line Options: | -server -Xmn21000m -Xms24000m -Xmx24000m -XX:SurvivorRatio=1 -XX:TargetSurvivorRatio=99 -XX:AllocatePrefetchDistance=256 -XX:AllocatePrefetchLines=4 -XX:LoopUnrollLimit=45 -XX:InitialTenuringThreshold=12 -XX:MaxTenuringThreshold=15 -XX:ParallelGCThreads=28 -XX:InlineSmallCode=3900 -XX:MaxInlineSize=270 -XX:FreqInlineSize=2500 -XX:+AggressiveOpts -XX:+UseLargePages -XX:+UseParallelOldGC |
| JVM Affinity: | start /NODE [0,1,2,3] /AFFINITY [0xFFFFFFF] |
| JVM Instances: | 4 |
| JVM Initial Heap (MB): | 24000 |
| JVM Maximum Heap (MB): | 24000 |
| JVM Address Bits: | 64 |
| Boot Firmware Version: | I42 v2.00 (02/02/2019) |
| Management Firmware Version: | 1.40 Feb 05 2019 |
| Workload Version: | SSJ 1.2.10 |
| Director Location: | Controller |
| Other Software: | HPE Service Pack for ProLiant (SPP) Version: 2019.03.0, Microsoft Windows KB4056898, KB4338815 |
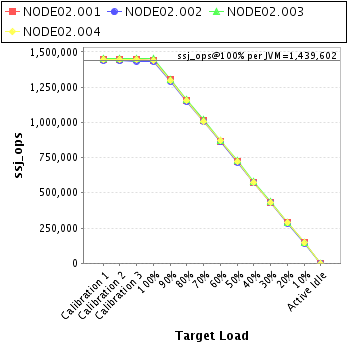
| JVM Instance | ssj_ops@100% |
|---|---|
| NODE02.001 | 1,436,838 |
| NODE02.002 | 1,431,992 |
| NODE02.003 | 1,449,913 |
| NODE02.004 | 1,439,667 |
| ssj_ops@100% | 5,758,409 |
| ssj_ops@100% per JVM | 1,439,602 |
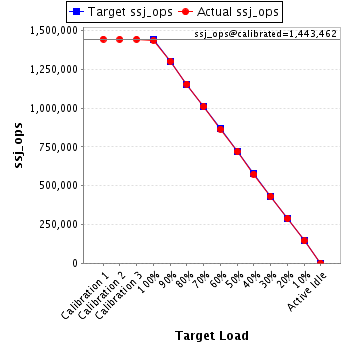
| Target Load | Actual Load | ssj_ops | |
|---|---|---|---|
| Target | Actual | ||
| Calibration 1 | 1,444,271 | ||
| Calibration 2 | 1,443,062 | ||
| Calibration 3 | 1,443,861 | ||
| ssj_ops@calibrated=1,443,462 | |||
| 100% | 99.5% | 1,443,462 | 1,436,838 |
| 90% | 90.2% | 1,299,116 | 1,301,579 |
| 80% | 80.0% | 1,154,769 | 1,154,389 |
| 70% | 70.0% | 1,010,423 | 1,009,999 |
| 60% | 59.9% | 866,077 | 864,926 |
| 50% | 49.8% | 721,731 | 719,329 |
| 40% | 39.8% | 577,385 | 574,518 |
| 30% | 29.9% | 433,039 | 432,195 |
| 20% | 20.0% | 288,692 | 288,245 |
| 10% | 10.0% | 144,346 | 144,841 |
| Active Idle | 0 | 0 | |
| Target Load | Actual Load | ssj_ops | |
|---|---|---|---|
| Target | Actual | ||
| Calibration 1 | 1,438,689 | ||
| Calibration 2 | 1,436,339 | ||
| Calibration 3 | 1,435,341 | ||
| ssj_ops@calibrated=1,435,840 | |||
| 100% | 99.7% | 1,435,840 | 1,431,992 |
| 90% | 90.0% | 1,292,256 | 1,292,339 |
| 80% | 79.8% | 1,148,672 | 1,145,925 |
| 70% | 70.1% | 1,005,088 | 1,006,467 |
| 60% | 60.0% | 861,504 | 861,009 |
| 50% | 50.0% | 717,920 | 717,338 |
| 40% | 39.9% | 574,336 | 572,557 |
| 30% | 30.1% | 430,752 | 431,808 |
| 20% | 19.9% | 287,168 | 285,220 |
| 10% | 10.0% | 143,584 | 143,446 |
| Active Idle | 0 | 0 | |

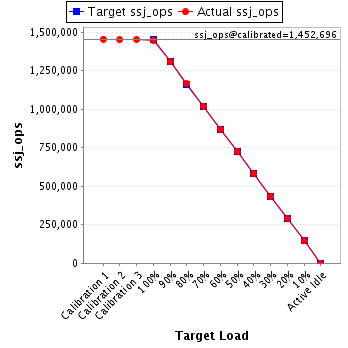
| Target Load | Actual Load | ssj_ops | |
|---|---|---|---|
| Target | Actual | ||
| Calibration 1 | 1,455,511 | ||
| Calibration 2 | 1,451,992 | ||
| Calibration 3 | 1,453,400 | ||
| ssj_ops@calibrated=1,452,696 | |||
| 100% | 99.8% | 1,452,696 | 1,449,913 |
| 90% | 90.0% | 1,307,426 | 1,307,314 |
| 80% | 80.2% | 1,162,157 | 1,164,544 |
| 70% | 70.2% | 1,016,887 | 1,019,428 |
| 60% | 60.0% | 871,617 | 871,869 |
| 50% | 50.0% | 726,348 | 726,119 |
| 40% | 40.0% | 581,078 | 581,206 |
| 30% | 30.0% | 435,809 | 435,735 |
| 20% | 20.0% | 290,539 | 290,867 |
| 10% | 10.0% | 145,270 | 144,805 |
| Active Idle | 0 | 0 | |
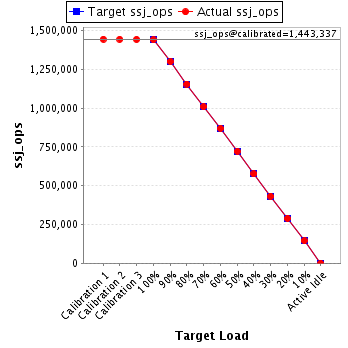
| Target Load | Actual Load | ssj_ops | |
|---|---|---|---|
| Target | Actual | ||
| Calibration 1 | 1,444,286 | ||
| Calibration 2 | 1,443,834 | ||
| Calibration 3 | 1,442,840 | ||
| ssj_ops@calibrated=1,443,337 | |||
| 100% | 99.7% | 1,443,337 | 1,439,667 |
| 90% | 90.1% | 1,299,003 | 1,299,977 |
| 80% | 80.0% | 1,154,670 | 1,155,016 |
| 70% | 69.9% | 1,010,336 | 1,008,886 |
| 60% | 60.3% | 866,002 | 869,775 |
| 50% | 50.0% | 721,668 | 722,163 |
| 40% | 39.9% | 577,335 | 575,661 |
| 30% | 30.0% | 433,001 | 432,700 |
| 20% | 20.1% | 288,667 | 289,535 |
| 10% | 10.0% | 144,334 | 144,697 |
| Active Idle | 0 | 0 | |