SPECpower_ssj2008
Host 'NODE04' Performance Report
Copyright © 2007-2019 Standard Performance Evaluation Corporation
| Hewlett Packard Enterprise Synergy 480 Gen10 Compute Module | ssj_ops@100% = 5,762,679 ssj_ops@100% per JVM = 1,440,670 |
||||
| Test Sponsor: | Hewlett Packard Enterprise | SPEC License #: | 3 | Test Method: | Multi Node |
| Tested By: | Hewlett Packard Enterprise | Test Location: | Houston, TX, USA | Test Date: | Mar 26, 2019 |
| Hardware Availability: | Apr-2019 | Software Availability: | Mar-2019 | Publication: | May 8, 2019 |
| System Source: | Single Supplier | System Designation: | Server | Power Provisioning: | Line-powered |
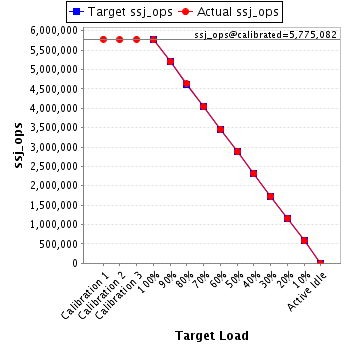
| Target Load | Actual Load | ssj_ops | |
|---|---|---|---|
| Target | Actual | ||
| Calibration 1 | 5,784,056 | ||
| Calibration 2 | 5,770,744 | ||
| Calibration 3 | 5,779,421 | ||
| ssj_ops@calibrated=5,775,082 | |||
| 100% | 99.8% | 5,775,082 | 5,762,679 |
| 90% | 90.1% | 5,197,574 | 5,202,099 |
| 80% | 80.2% | 4,620,066 | 4,630,244 |
| 70% | 69.9% | 4,042,558 | 4,039,664 |
| 60% | 59.9% | 3,465,049 | 3,461,061 |
| 50% | 50.0% | 2,887,541 | 2,885,165 |
| 40% | 40.0% | 2,310,033 | 2,312,544 |
| 30% | 30.0% | 1,732,525 | 1,730,871 |
| 20% | 20.0% | 1,155,016 | 1,154,064 |
| 10% | 10.0% | 577,508 | 576,504 |
| Active Idle | 0 | 0 | |
| Set Identifier: | SUT |
| Set Description: | System Under Test |
| # of Identical Nodes: | 9 |
| Comment: | SUT |
| Hardware | |
|---|---|
| Hardware Vendor: | Hewlett Packard Enterprise |
| Model: | Synergy 480 Gen10 Compute Module |
| Form Factor: | 7U |
| CPU Name: | Intel Xeon Platinum 8280 @ 2.70GHz (Intel Turbo Boost Technology up to 4.00 GHz) |
| CPU Characteristics: | 28-Core, 2.70 GHz, 38.5MB L3 Cache |
| CPU Frequency (MHz): | 2700 |
| CPU(s) Enabled: | 56 cores, 2 chips, 28 cores/chip |
| Hardware Threads: | 112 (2 / core) |
| CPU(s) Orderable: | 1,2 chips |
| Primary Cache: | 32 KB I + 32 KB D on chip per core |
| Secondary Cache: | 1 MB I+D on chip per core |
| Tertiary Cache: | 39424 KB I+D on chip per chip |
| Other Cache: | None |
| Memory Amount (GB): | 192 |
| # and size of DIMM: | 12 x 16384 MB |
| Memory Details: | 12 x 16GB 2Rx8 PC4-2933Y-R; slots 1, 3, 5, 8, 10 and 12 populated in each socket |
| Power Supply Quantity and Rating (W): | None |
| Power Supply Details: | N/A |
| Disk Drive: | 1 x HPE 240GB 6G SATA M.2 SSD (875488-B21) |
| Disk Controller: | HPE Smart Array S100i SR Gen10 |
| # and type of Network Interface Cards (NICs) Installed: | 1 x HPE Synergy 3820C 10/20Gb CNA |
| NICs Enabled in Firmware / OS / Connected: | 2/2/1 |
| Network Speed (Mbit): | 1000 |
| Keyboard: | None |
| Mouse: | None |
| Monitor: | None |
| Optical Drives: | No |
| Other Hardware: | H/S: Standard |
| Software | |
|---|---|
| Power Management: | Enabled (see SUT Notes) |
| Operating System (OS): | Windows Server 2012 R2 Datacenter |
| OS Version: | Version 6.3 (Build 9600) |
| Filesystem: | NTFS |
| JVM Vendor: | Oracle Corporation |
| JVM Version: | Oracle Java HotSpot(TM) 64-Bit Server VM (build 24.80-b11, mixed mode), version 1.7.0_80 |
| JVM Command-line Options: | -server -Xmn21000m -Xms24000m -Xmx24000m -XX:SurvivorRatio=1 -XX:TargetSurvivorRatio=99 -XX:AllocatePrefetchDistance=256 -XX:AllocatePrefetchLines=4 -XX:LoopUnrollLimit=45 -XX:InitialTenuringThreshold=12 -XX:MaxTenuringThreshold=15 -XX:ParallelGCThreads=28 -XX:InlineSmallCode=3900 -XX:MaxInlineSize=270 -XX:FreqInlineSize=2500 -XX:+AggressiveOpts -XX:+UseLargePages -XX:+UseParallelOldGC |
| JVM Affinity: | start /NODE [0,1,2,3] /AFFINITY [0xFFFFFFF] |
| JVM Instances: | 4 |
| JVM Initial Heap (MB): | 24000 |
| JVM Maximum Heap (MB): | 24000 |
| JVM Address Bits: | 64 |
| Boot Firmware Version: | I42 v2.00 (02/02/2019) |
| Management Firmware Version: | 1.40 Feb 05 2019 |
| Workload Version: | SSJ 1.2.10 |
| Director Location: | Controller |
| Other Software: | HPE Service Pack for ProLiant (SPP) Version: 2019.03.0, Microsoft Windows KB4056898, KB4338815 |
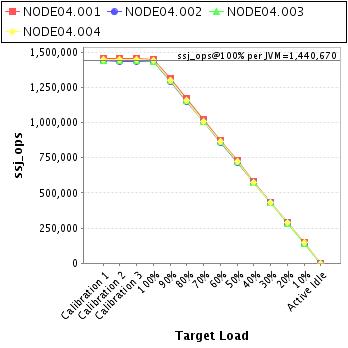
| JVM Instance | ssj_ops@100% |
|---|---|
| NODE04.001 | 1,450,537 |
| NODE04.002 | 1,431,595 |
| NODE04.003 | 1,436,975 |
| NODE04.004 | 1,443,571 |
| ssj_ops@100% | 5,762,679 |
| ssj_ops@100% per JVM | 1,440,670 |
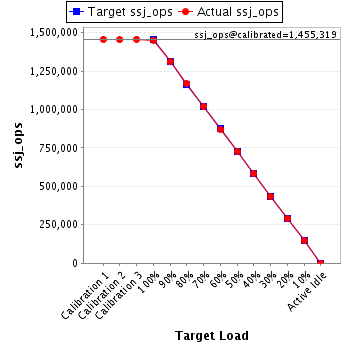
| Target Load | Actual Load | ssj_ops | |
|---|---|---|---|
| Target | Actual | ||
| Calibration 1 | 1,456,687 | ||
| Calibration 2 | 1,453,520 | ||
| Calibration 3 | 1,457,119 | ||
| ssj_ops@calibrated=1,455,319 | |||
| 100% | 99.7% | 1,455,319 | 1,450,537 |
| 90% | 90.0% | 1,309,787 | 1,309,331 |
| 80% | 80.3% | 1,164,255 | 1,168,352 |
| 70% | 70.0% | 1,018,723 | 1,018,321 |
| 60% | 59.9% | 873,191 | 872,350 |
| 50% | 50.0% | 727,660 | 727,144 |
| 40% | 40.0% | 582,128 | 582,457 |
| 30% | 29.8% | 436,596 | 434,202 |
| 20% | 20.0% | 291,064 | 291,264 |
| 10% | 10.0% | 145,532 | 146,117 |
| Active Idle | 0 | 0 | |
| Target Load | Actual Load | ssj_ops | |
|---|---|---|---|
| Target | Actual | ||
| Calibration 1 | 1,437,780 | ||
| Calibration 2 | 1,433,108 | ||
| Calibration 3 | 1,436,715 | ||
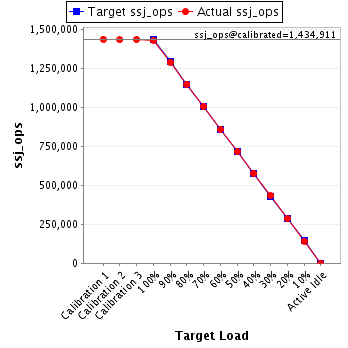
| ssj_ops@calibrated=1,434,911 | |||
| 100% | 99.8% | 1,434,911 | 1,431,595 |
| 90% | 90.0% | 1,291,420 | 1,290,724 |
| 80% | 80.1% | 1,147,929 | 1,149,047 |
| 70% | 70.0% | 1,004,438 | 1,004,962 |
| 60% | 59.9% | 860,947 | 858,869 |
| 50% | 49.9% | 717,456 | 716,463 |
| 40% | 40.2% | 573,965 | 576,879 |
| 30% | 30.1% | 430,473 | 432,059 |
| 20% | 20.0% | 286,982 | 287,426 |
| 10% | 9.9% | 143,491 | 142,484 |
| Active Idle | 0 | 0 | |
| Target Load | Actual Load | ssj_ops | |
|---|---|---|---|
| Target | Actual | ||
| Calibration 1 | 1,442,869 | ||
| Calibration 2 | 1,438,758 | ||
| Calibration 3 | 1,439,814 | ||
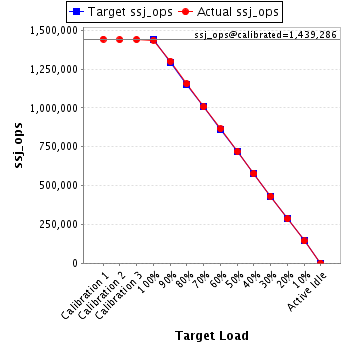
| ssj_ops@calibrated=1,439,286 | |||
| 100% | 99.8% | 1,439,286 | 1,436,975 |
| 90% | 90.4% | 1,295,357 | 1,300,644 |
| 80% | 80.3% | 1,151,429 | 1,155,817 |
| 70% | 69.9% | 1,007,500 | 1,006,637 |
| 60% | 60.1% | 863,571 | 865,618 |
| 50% | 50.0% | 719,643 | 719,618 |
| 40% | 40.1% | 575,714 | 576,586 |
| 30% | 30.0% | 431,786 | 431,958 |
| 20% | 19.9% | 287,857 | 285,768 |
| 10% | 10.0% | 143,929 | 143,670 |
| Active Idle | 0 | 0 | |
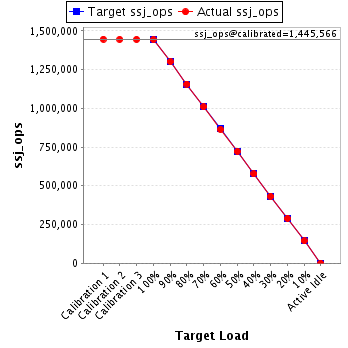
| Target Load | Actual Load | ssj_ops | |
|---|---|---|---|
| Target | Actual | ||
| Calibration 1 | 1,446,721 | ||
| Calibration 2 | 1,445,359 | ||
| Calibration 3 | 1,445,773 | ||
| ssj_ops@calibrated=1,445,566 | |||
| 100% | 99.9% | 1,445,566 | 1,443,571 |
| 90% | 90.0% | 1,301,010 | 1,301,400 |
| 80% | 80.0% | 1,156,453 | 1,157,028 |
| 70% | 69.9% | 1,011,896 | 1,009,744 |
| 60% | 59.8% | 867,340 | 864,224 |
| 50% | 49.9% | 722,783 | 721,940 |
| 40% | 39.9% | 578,227 | 576,622 |
| 30% | 29.9% | 433,670 | 432,651 |
| 20% | 20.0% | 289,113 | 289,606 |
| 10% | 10.0% | 144,557 | 144,233 |
| Active Idle | 0 | 0 | |