SPECpower_ssj2008
Host 'NODE02' Performance Report
Copyright © 2007-2019 Standard Performance Evaluation Corporation
| Hewlett Packard Enterprise Synergy 480 Gen10 Compute Module | ssj_ops@100% = 5,769,564 ssj_ops@100% per JVM = 1,442,391 |
||||
| Test Sponsor: | Hewlett Packard Enterprise | SPEC License #: | 3 | Test Method: | Multi Node |
| Tested By: | Hewlett Packard Enterprise | Test Location: | Houston, TX, USA | Test Date: | Mar 26, 2019 |
| Hardware Availability: | Apr-2019 | Software Availability: | Mar-2019 | Publication: | May 8, 2019 |
| System Source: | Single Supplier | System Designation: | Server | Power Provisioning: | Line-powered |
| Target Load | Actual Load | ssj_ops | |
|---|---|---|---|
| Target | Actual | ||
| Calibration 1 | 5,793,888 | ||
| Calibration 2 | 5,778,833 | ||
| Calibration 3 | 5,788,588 | ||
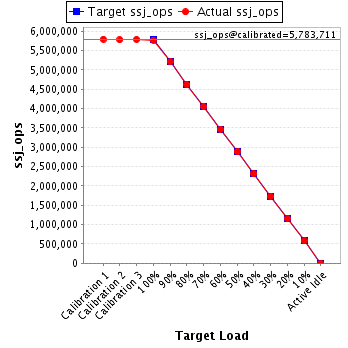
| ssj_ops@calibrated=5,783,711 | |||
| 100% | 99.8% | 5,783,711 | 5,769,564 |
| 90% | 90.0% | 5,205,340 | 5,204,789 |
| 80% | 80.0% | 4,626,968 | 4,626,459 |
| 70% | 70.0% | 4,048,597 | 4,048,052 |
| 60% | 60.0% | 3,470,226 | 3,470,891 |
| 50% | 49.9% | 2,891,855 | 2,888,210 |
| 40% | 40.0% | 2,313,484 | 2,311,711 |
| 30% | 30.0% | 1,735,113 | 1,734,547 |
| 20% | 20.0% | 1,156,742 | 1,156,242 |
| 10% | 10.0% | 578,371 | 576,715 |
| Active Idle | 0 | 0 | |
| Set Identifier: | SUT |
| Set Description: | System Under Test |
| # of Identical Nodes: | 8 |
| Comment: | SUT |
| Hardware | |
|---|---|
| Hardware Vendor: | Hewlett Packard Enterprise |
| Model: | Synergy 480 Gen10 Compute Module |
| Form Factor: | 7U |
| CPU Name: | Intel Xeon Platinum 8280 @ 2.70GHz (Intel Turbo Boost Technology up to 4.00 GHz) |
| CPU Characteristics: | 28-Core, 2.70 GHz, 38.5MB L3 Cache |
| CPU Frequency (MHz): | 2700 |
| CPU(s) Enabled: | 56 cores, 2 chips, 28 cores/chip |
| Hardware Threads: | 112 (2 / core) |
| CPU(s) Orderable: | 1,2 chips |
| Primary Cache: | 32 KB I + 32 KB D on chip per core |
| Secondary Cache: | 1 MB I+D on chip per core |
| Tertiary Cache: | 39424 KB I+D on chip per chip |
| Other Cache: | None |
| Memory Amount (GB): | 192 |
| # and size of DIMM: | 12 x 16384 MB |
| Memory Details: | 12 x 16GB 2Rx8 PC4-2933Y-R; slots 1, 3, 5, 8, 10 and 12 populated in each socket |
| Power Supply Quantity and Rating (W): | None |
| Power Supply Details: | N/A |
| Disk Drive: | 1 x HPE 240GB 6G SATA M.2 SSD (875488-B21) |
| Disk Controller: | HPE Smart Array S100i SR Gen10 |
| # and type of Network Interface Cards (NICs) Installed: | 1 x HPE Synergy 3820C 10/20Gb CNA |
| NICs Enabled in Firmware / OS / Connected: | 2/2/1 |
| Network Speed (Mbit): | 1000 |
| Keyboard: | None |
| Mouse: | None |
| Monitor: | None |
| Optical Drives: | No |
| Other Hardware: | H/S: Standard |
| Software | |
|---|---|
| Power Management: | Enabled (see SUT Notes) |
| Operating System (OS): | Windows Server 2012 R2 Datacenter |
| OS Version: | Version 6.3 (Build 9600) |
| Filesystem: | NTFS |
| JVM Vendor: | Oracle Corporation |
| JVM Version: | Oracle Java HotSpot(TM) 64-Bit Server VM (build 24.80-b11, mixed mode), version 1.7.0_80 |
| JVM Command-line Options: | -server -Xmn21000m -Xms24000m -Xmx24000m -XX:SurvivorRatio=1 -XX:TargetSurvivorRatio=99 -XX:AllocatePrefetchDistance=256 -XX:AllocatePrefetchLines=4 -XX:LoopUnrollLimit=45 -XX:InitialTenuringThreshold=12 -XX:MaxTenuringThreshold=15 -XX:ParallelGCThreads=28 -XX:InlineSmallCode=3900 -XX:MaxInlineSize=270 -XX:FreqInlineSize=2500 -XX:+AggressiveOpts -XX:+UseLargePages -XX:+UseParallelOldGC |
| JVM Affinity: | start /NODE [0,1,2,3] /AFFINITY [0xFFFFFFF] |
| JVM Instances: | 4 |
| JVM Initial Heap (MB): | 24000 |
| JVM Maximum Heap (MB): | 24000 |
| JVM Address Bits: | 64 |
| Boot Firmware Version: | I42 v2.00 (02/02/2019) |
| Management Firmware Version: | 1.40 Feb 05 2019 |
| Workload Version: | SSJ 1.2.10 |
| Director Location: | Controller |
| Other Software: | HPE Service Pack for ProLiant (SPP) Version: 2019.03.0, Microsoft Windows KB4056898, KB4338815 |
| JVM Instance | ssj_ops@100% |
|---|---|
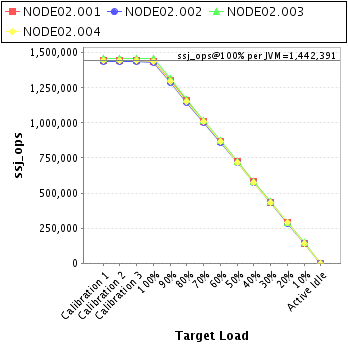
| NODE02.001 | 1,440,454 |
| NODE02.002 | 1,432,365 |
| NODE02.003 | 1,456,504 |
| NODE02.004 | 1,440,240 |
| ssj_ops@100% | 5,769,564 |
| ssj_ops@100% per JVM | 1,442,391 |
| Target Load | Actual Load | ssj_ops | |
|---|---|---|---|
| Target | Actual | ||
| Calibration 1 | 1,448,170 | ||
| Calibration 2 | 1,444,335 | ||
| Calibration 3 | 1,446,402 | ||
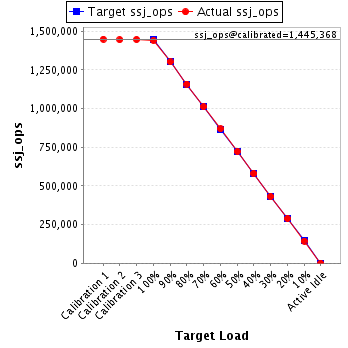
| ssj_ops@calibrated=1,445,368 | |||
| 100% | 99.7% | 1,445,368 | 1,440,454 |
| 90% | 90.0% | 1,300,831 | 1,301,515 |
| 80% | 80.1% | 1,156,295 | 1,158,117 |
| 70% | 70.0% | 1,011,758 | 1,011,616 |
| 60% | 60.1% | 867,221 | 868,204 |
| 50% | 49.9% | 722,684 | 721,867 |
| 40% | 40.1% | 578,147 | 579,505 |
| 30% | 29.9% | 433,610 | 431,543 |
| 20% | 20.0% | 289,074 | 288,509 |
| 10% | 9.9% | 144,537 | 143,759 |
| Active Idle | 0 | 0 | |
| Target Load | Actual Load | ssj_ops | |
|---|---|---|---|
| Target | Actual | ||
| Calibration 1 | 1,437,384 | ||
| Calibration 2 | 1,436,589 | ||
| Calibration 3 | 1,438,265 | ||
| ssj_ops@calibrated=1,437,427 | |||
| 100% | 99.6% | 1,437,427 | 1,432,365 |
| 90% | 89.6% | 1,293,684 | 1,288,234 |
| 80% | 79.8% | 1,149,942 | 1,147,701 |
| 70% | 70.0% | 1,006,199 | 1,006,382 |
| 60% | 59.8% | 862,456 | 859,453 |
| 50% | 50.0% | 718,714 | 718,440 |
| 40% | 39.9% | 574,971 | 573,761 |
| 30% | 30.0% | 431,228 | 431,941 |
| 20% | 19.9% | 287,485 | 285,683 |
| 10% | 10.0% | 143,743 | 143,988 |
| Active Idle | 0 | 0 | |

| Target Load | Actual Load | ssj_ops | |
|---|---|---|---|
| Target | Actual | ||
| Calibration 1 | 1,461,174 | ||
| Calibration 2 | 1,456,772 | ||
| Calibration 3 | 1,459,754 | ||
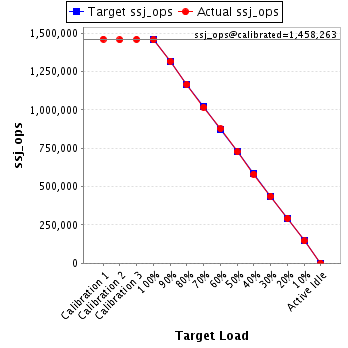
| ssj_ops@calibrated=1,458,263 | |||
| 100% | 99.9% | 1,458,263 | 1,456,504 |
| 90% | 90.3% | 1,312,437 | 1,317,049 |
| 80% | 79.9% | 1,166,610 | 1,165,868 |
| 70% | 69.8% | 1,020,784 | 1,017,973 |
| 60% | 60.1% | 874,958 | 877,138 |
| 50% | 49.9% | 729,131 | 727,177 |
| 40% | 39.8% | 583,305 | 580,798 |
| 30% | 30.0% | 437,479 | 437,488 |
| 20% | 20.1% | 291,653 | 293,204 |
| 10% | 10.0% | 145,826 | 145,759 |
| Active Idle | 0 | 0 | |
| Target Load | Actual Load | ssj_ops | |
|---|---|---|---|
| Target | Actual | ||
| Calibration 1 | 1,447,160 | ||
| Calibration 2 | 1,441,137 | ||
| Calibration 3 | 1,444,167 | ||
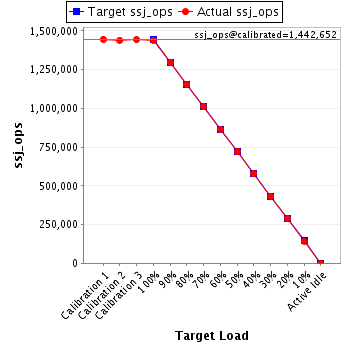
| ssj_ops@calibrated=1,442,652 | |||
| 100% | 99.8% | 1,442,652 | 1,440,240 |
| 90% | 90.0% | 1,298,387 | 1,297,990 |
| 80% | 80.0% | 1,154,122 | 1,154,774 |
| 70% | 70.2% | 1,009,857 | 1,012,081 |
| 60% | 60.0% | 865,591 | 866,096 |
| 50% | 50.0% | 721,326 | 720,726 |
| 40% | 40.0% | 577,061 | 577,647 |
| 30% | 30.1% | 432,796 | 433,574 |
| 20% | 20.0% | 288,530 | 288,845 |
| 10% | 9.9% | 144,265 | 143,209 |
| Active Idle | 0 | 0 | |