SPECpower_ssj2008
Host 'NODE01' Performance Report
Copyright © 2007-2019 Standard Performance Evaluation Corporation
| Hewlett Packard Enterprise Synergy 480 Gen10 Compute Module | ssj_ops@100% = 5,718,775 ssj_ops@100% per JVM = 1,429,694 |
||||
| Test Sponsor: | Hewlett Packard Enterprise | SPEC License #: | 3 | Test Method: | Multi Node |
| Tested By: | Hewlett Packard Enterprise | Test Location: | Houston, TX, USA | Test Date: | Mar 26, 2019 |
| Hardware Availability: | Apr-2019 | Software Availability: | Mar-2019 | Publication: | May 8, 2019 |
| System Source: | Single Supplier | System Designation: | Server | Power Provisioning: | Line-powered |
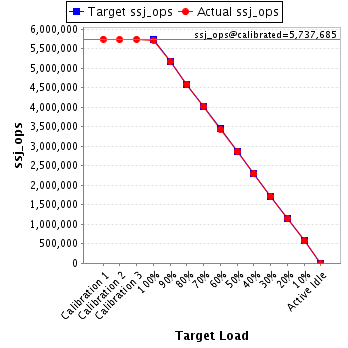
| Target Load | Actual Load | ssj_ops | |
|---|---|---|---|
| Target | Actual | ||
| Calibration 1 | 5,745,563 | ||
| Calibration 2 | 5,732,335 | ||
| Calibration 3 | 5,743,035 | ||
| ssj_ops@calibrated=5,737,685 | |||
| 100% | 99.7% | 5,737,685 | 5,718,775 |
| 90% | 90.0% | 5,163,916 | 5,164,966 |
| 80% | 80.0% | 4,590,148 | 4,591,336 |
| 70% | 70.0% | 4,016,379 | 4,014,875 |
| 60% | 60.0% | 3,442,611 | 3,440,838 |
| 50% | 49.9% | 2,868,842 | 2,864,477 |
| 40% | 39.9% | 2,295,074 | 2,290,689 |
| 30% | 30.0% | 1,721,305 | 1,721,201 |
| 20% | 20.0% | 1,147,537 | 1,145,764 |
| 10% | 10.0% | 573,768 | 574,361 |
| Active Idle | 0 | 0 | |
| Set Identifier: | SUT |
| Set Description: | System Under Test |
| # of Identical Nodes: | 7 |
| Comment: | SUT |
| Hardware | |
|---|---|
| Hardware Vendor: | Hewlett Packard Enterprise |
| Model: | Synergy 480 Gen10 Compute Module |
| Form Factor: | 7U |
| CPU Name: | Intel Xeon Platinum 8280 @ 2.70GHz (Intel Turbo Boost Technology up to 4.00 GHz) |
| CPU Characteristics: | 28-Core, 2.70 GHz, 38.5MB L3 Cache |
| CPU Frequency (MHz): | 2700 |
| CPU(s) Enabled: | 56 cores, 2 chips, 28 cores/chip |
| Hardware Threads: | 112 (2 / core) |
| CPU(s) Orderable: | 1,2 chips |
| Primary Cache: | 32 KB I + 32 KB D on chip per core |
| Secondary Cache: | 1 MB I+D on chip per core |
| Tertiary Cache: | 39424 KB I+D on chip per chip |
| Other Cache: | None |
| Memory Amount (GB): | 192 |
| # and size of DIMM: | 12 x 16384 MB |
| Memory Details: | 12 x 16GB 2Rx8 PC4-2933Y-R; slots 1, 3, 5, 8, 10 and 12 populated in each socket |
| Power Supply Quantity and Rating (W): | None |
| Power Supply Details: | N/A |
| Disk Drive: | 1 x HPE 240GB 6G SATA M.2 SSD (875488-B21) |
| Disk Controller: | HPE Smart Array S100i SR Gen10 |
| # and type of Network Interface Cards (NICs) Installed: | 1 x HPE Synergy 3820C 10/20Gb CNA |
| NICs Enabled in Firmware / OS / Connected: | 2/2/1 |
| Network Speed (Mbit): | 1000 |
| Keyboard: | None |
| Mouse: | None |
| Monitor: | None |
| Optical Drives: | No |
| Other Hardware: | H/S: Standard |
| Software | |
|---|---|
| Power Management: | Enabled (see SUT Notes) |
| Operating System (OS): | Windows Server 2012 R2 Datacenter |
| OS Version: | Version 6.3 (Build 9600) |
| Filesystem: | NTFS |
| JVM Vendor: | Oracle Corporation |
| JVM Version: | Oracle Java HotSpot(TM) 64-Bit Server VM (build 24.80-b11, mixed mode), version 1.7.0_80 |
| JVM Command-line Options: | -server -Xmn21000m -Xms24000m -Xmx24000m -XX:SurvivorRatio=1 -XX:TargetSurvivorRatio=99 -XX:AllocatePrefetchDistance=256 -XX:AllocatePrefetchLines=4 -XX:LoopUnrollLimit=45 -XX:InitialTenuringThreshold=12 -XX:MaxTenuringThreshold=15 -XX:ParallelGCThreads=28 -XX:InlineSmallCode=3900 -XX:MaxInlineSize=270 -XX:FreqInlineSize=2500 -XX:+AggressiveOpts -XX:+UseLargePages -XX:+UseParallelOldGC |
| JVM Affinity: | start /NODE [0,1,2,3] /AFFINITY [0xFFFFFFF] |
| JVM Instances: | 4 |
| JVM Initial Heap (MB): | 21000 |
| JVM Maximum Heap (MB): | 21000 |
| JVM Address Bits: | 64 |
| Boot Firmware Version: | I42 v2.00 (02/02/2019) |
| Management Firmware Version: | 1.40 Feb 05 2019 |
| Workload Version: | SSJ 1.2.10 |
| Director Location: | Controller |
| Other Software: | HPE Service Pack for ProLiant (SPP) Version: 2019.03.0, Microsoft Windows KB4056898, KB4338815 |
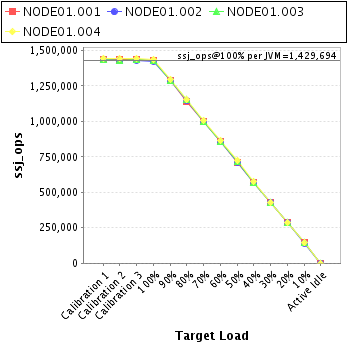
| JVM Instance | ssj_ops@100% |
|---|---|
| NODE01.001 | 1,429,567 |
| NODE01.002 | 1,425,186 |
| NODE01.003 | 1,426,926 |
| NODE01.004 | 1,437,096 |
| ssj_ops@100% | 5,718,775 |
| ssj_ops@100% per JVM | 1,429,694 |
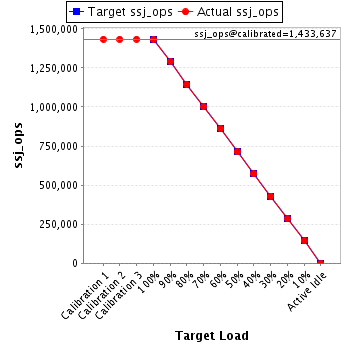
| Target Load | Actual Load | ssj_ops | |
|---|---|---|---|
| Target | Actual | ||
| Calibration 1 | 1,433,368 | ||
| Calibration 2 | 1,433,348 | ||
| Calibration 3 | 1,433,927 | ||
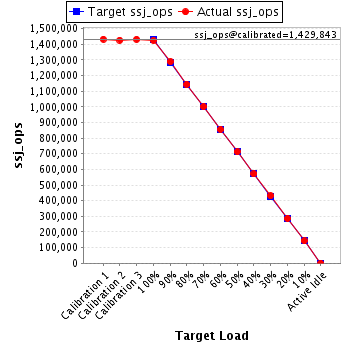
| ssj_ops@calibrated=1,433,637 | |||
| 100% | 99.7% | 1,433,637 | 1,429,567 |
| 90% | 90.0% | 1,290,274 | 1,290,493 |
| 80% | 79.8% | 1,146,910 | 1,143,691 |
| 70% | 69.8% | 1,003,546 | 1,001,345 |
| 60% | 60.1% | 860,182 | 861,147 |
| 50% | 49.7% | 716,819 | 712,326 |
| 40% | 39.9% | 573,455 | 571,689 |
| 30% | 30.0% | 430,091 | 430,017 |
| 20% | 19.9% | 286,727 | 284,705 |
| 10% | 10.0% | 143,364 | 143,162 |
| Active Idle | 0 | 0 | |
| Target Load | Actual Load | ssj_ops | |
|---|---|---|---|
| Target | Actual | ||
| Calibration 1 | 1,433,132 | ||
| Calibration 2 | 1,427,092 | ||
| Calibration 3 | 1,432,593 | ||
| ssj_ops@calibrated=1,429,843 | |||
| 100% | 99.7% | 1,429,843 | 1,425,186 |
| 90% | 90.2% | 1,286,858 | 1,289,478 |
| 80% | 80.0% | 1,143,874 | 1,144,197 |
| 70% | 70.0% | 1,000,890 | 1,001,363 |
| 60% | 59.9% | 857,906 | 856,683 |
| 50% | 49.8% | 714,921 | 712,697 |
| 40% | 39.9% | 571,937 | 571,180 |
| 30% | 30.2% | 428,953 | 431,139 |
| 20% | 20.0% | 285,969 | 286,488 |
| 10% | 10.0% | 142,984 | 142,818 |
| Active Idle | 0 | 0 | |
| Target Load | Actual Load | ssj_ops | |
|---|---|---|---|
| Target | Actual | ||
| Calibration 1 | 1,433,416 | ||
| Calibration 2 | 1,431,794 | ||
| Calibration 3 | 1,434,855 | ||
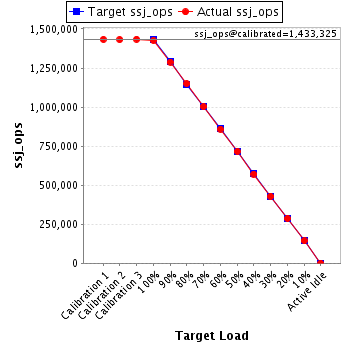
| ssj_ops@calibrated=1,433,325 | |||
| 100% | 99.6% | 1,433,325 | 1,426,926 |
| 90% | 89.9% | 1,289,992 | 1,288,480 |
| 80% | 80.3% | 1,146,660 | 1,151,270 |
| 70% | 69.9% | 1,003,327 | 1,002,596 |
| 60% | 60.0% | 859,995 | 859,649 |
| 50% | 50.0% | 716,662 | 716,128 |
| 40% | 39.9% | 573,330 | 571,530 |
| 30% | 30.0% | 429,997 | 429,398 |
| 20% | 20.0% | 286,665 | 286,786 |
| 10% | 10.0% | 143,332 | 143,898 |
| Active Idle | 0 | 0 | |
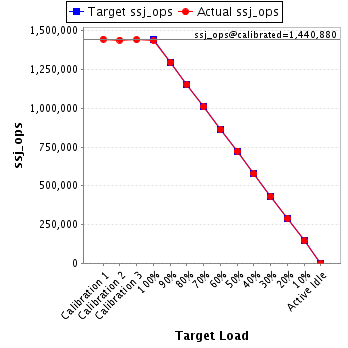
| Target Load | Actual Load | ssj_ops | |
|---|---|---|---|
| Target | Actual | ||
| Calibration 1 | 1,445,647 | ||
| Calibration 2 | 1,440,101 | ||
| Calibration 3 | 1,441,659 | ||
| ssj_ops@calibrated=1,440,880 | |||
| 100% | 99.7% | 1,440,880 | 1,437,096 |
| 90% | 90.0% | 1,296,792 | 1,296,516 |
| 80% | 80.0% | 1,152,704 | 1,152,178 |
| 70% | 70.1% | 1,008,616 | 1,009,572 |
| 60% | 59.9% | 864,528 | 863,359 |
| 50% | 50.2% | 720,440 | 723,325 |
| 40% | 40.0% | 576,352 | 576,290 |
| 30% | 29.9% | 432,264 | 430,647 |
| 20% | 20.0% | 288,176 | 287,785 |
| 10% | 10.0% | 144,088 | 144,482 |
| Active Idle | 0 | 0 | |