SPECpower_ssj2008
Host 'NODE02' Performance Report
Copyright © 2007-2019 Standard Performance Evaluation Corporation
| Hewlett Packard Enterprise Synergy 480 Gen10 Compute Module | ssj_ops@100% = 5,765,811 ssj_ops@100% per JVM = 1,441,453 |
||||
| Test Sponsor: | Hewlett Packard Enterprise | SPEC License #: | 3 | Test Method: | Multi Node |
| Tested By: | Hewlett Packard Enterprise | Test Location: | Houston, TX, USA | Test Date: | Mar 26, 2019 |
| Hardware Availability: | Apr-2019 | Software Availability: | Mar-2019 | Publication: | May 8, 2019 |
| System Source: | Single Supplier | System Designation: | Server | Power Provisioning: | Line-powered |
| Target Load | Actual Load | ssj_ops | |
|---|---|---|---|
| Target | Actual | ||
| Calibration 1 | 5,783,314 | ||
| Calibration 2 | 5,783,151 | ||
| Calibration 3 | 5,786,209 | ||
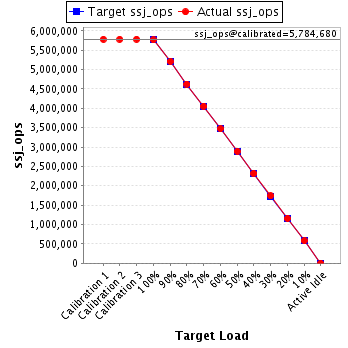
| ssj_ops@calibrated=5,784,680 | |||
| 100% | 99.7% | 5,784,680 | 5,765,811 |
| 90% | 90.1% | 5,206,212 | 5,211,463 |
| 80% | 80.0% | 4,627,744 | 4,627,903 |
| 70% | 70.2% | 4,049,276 | 4,059,770 |
| 60% | 60.0% | 3,470,808 | 3,469,480 |
| 50% | 50.0% | 2,892,340 | 2,892,819 |
| 40% | 40.1% | 2,313,872 | 2,317,314 |
| 30% | 30.0% | 1,735,404 | 1,737,472 |
| 20% | 20.0% | 1,156,936 | 1,157,789 |
| 10% | 10.0% | 578,468 | 579,733 |
| Active Idle | 0 | 0 | |
| Set Identifier: | SUT |
| Set Description: | System Under Test |
| # of Identical Nodes: | 7 |
| Comment: | SUT |
| Hardware | |
|---|---|
| Hardware Vendor: | Hewlett Packard Enterprise |
| Model: | Synergy 480 Gen10 Compute Module |
| Form Factor: | 7U |
| CPU Name: | Intel Xeon Platinum 8280 @ 2.70GHz (Intel Turbo Boost Technology up to 4.00 GHz) |
| CPU Characteristics: | 28-Core, 2.70 GHz, 38.5MB L3 Cache |
| CPU Frequency (MHz): | 2700 |
| CPU(s) Enabled: | 56 cores, 2 chips, 28 cores/chip |
| Hardware Threads: | 112 (2 / core) |
| CPU(s) Orderable: | 1,2 chips |
| Primary Cache: | 32 KB I + 32 KB D on chip per core |
| Secondary Cache: | 1 MB I+D on chip per core |
| Tertiary Cache: | 39424 KB I+D on chip per chip |
| Other Cache: | None |
| Memory Amount (GB): | 192 |
| # and size of DIMM: | 12 x 16384 MB |
| Memory Details: | 12 x 16GB 2Rx8 PC4-2933Y-R; slots 1, 3, 5, 8, 10 and 12 populated in each socket |
| Power Supply Quantity and Rating (W): | None |
| Power Supply Details: | N/A |
| Disk Drive: | 1 x HPE 240GB 6G SATA M.2 SSD (875488-B21) |
| Disk Controller: | HPE Smart Array S100i SR Gen10 |
| # and type of Network Interface Cards (NICs) Installed: | 1 x HPE Synergy 3820C 10/20Gb CNA |
| NICs Enabled in Firmware / OS / Connected: | 2/2/1 |
| Network Speed (Mbit): | 1000 |
| Keyboard: | None |
| Mouse: | None |
| Monitor: | None |
| Optical Drives: | No |
| Other Hardware: | H/S: Standard |
| Software | |
|---|---|
| Power Management: | Enabled (see SUT Notes) |
| Operating System (OS): | Windows Server 2012 R2 Datacenter |
| OS Version: | Version 6.3 (Build 9600) |
| Filesystem: | NTFS |
| JVM Vendor: | Oracle Corporation |
| JVM Version: | Oracle Java HotSpot(TM) 64-Bit Server VM (build 24.80-b11, mixed mode), version 1.7.0_80 |
| JVM Command-line Options: | -server -Xmn21000m -Xms24000m -Xmx24000m -XX:SurvivorRatio=1 -XX:TargetSurvivorRatio=99 -XX:AllocatePrefetchDistance=256 -XX:AllocatePrefetchLines=4 -XX:LoopUnrollLimit=45 -XX:InitialTenuringThreshold=12 -XX:MaxTenuringThreshold=15 -XX:ParallelGCThreads=28 -XX:InlineSmallCode=3900 -XX:MaxInlineSize=270 -XX:FreqInlineSize=2500 -XX:+AggressiveOpts -XX:+UseLargePages -XX:+UseParallelOldGC |
| JVM Affinity: | start /NODE [0,1,2,3] /AFFINITY [0xFFFFFFF] |
| JVM Instances: | 4 |
| JVM Initial Heap (MB): | 21000 |
| JVM Maximum Heap (MB): | 21000 |
| JVM Address Bits: | 64 |
| Boot Firmware Version: | I42 v2.00 (02/02/2019) |
| Management Firmware Version: | 1.40 Feb 05 2019 |
| Workload Version: | SSJ 1.2.10 |
| Director Location: | Controller |
| Other Software: | HPE Service Pack for ProLiant (SPP) Version: 2019.03.0, Microsoft Windows KB4056898, KB4338815 |
| JVM Instance | ssj_ops@100% |
|---|---|
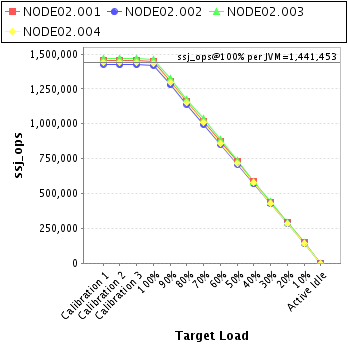
| NODE02.001 | 1,449,854 |
| NODE02.002 | 1,418,161 |
| NODE02.003 | 1,464,002 |
| NODE02.004 | 1,433,794 |
| ssj_ops@100% | 5,765,811 |
| ssj_ops@100% per JVM | 1,441,453 |
| Target Load | Actual Load | ssj_ops | |
|---|---|---|---|
| Target | Actual | ||
| Calibration 1 | 1,451,652 | ||
| Calibration 2 | 1,450,898 | ||
| Calibration 3 | 1,455,018 | ||
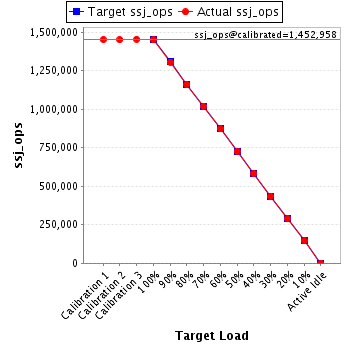
| ssj_ops@calibrated=1,452,958 | |||
| 100% | 99.8% | 1,452,958 | 1,449,854 |
| 90% | 89.9% | 1,307,662 | 1,306,719 |
| 80% | 80.0% | 1,162,366 | 1,161,863 |
| 70% | 70.2% | 1,017,071 | 1,019,422 |
| 60% | 60.0% | 871,775 | 871,836 |
| 50% | 50.1% | 726,479 | 728,135 |
| 40% | 40.1% | 581,183 | 582,861 |
| 30% | 30.0% | 435,887 | 436,252 |
| 20% | 20.0% | 290,592 | 290,061 |
| 10% | 10.0% | 145,296 | 145,791 |
| Active Idle | 0 | 0 | |
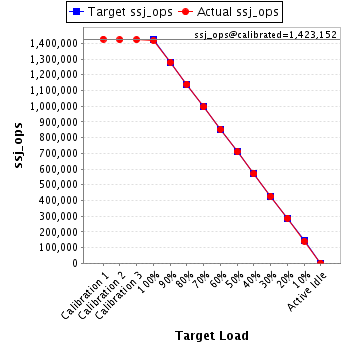
| Target Load | Actual Load | ssj_ops | |
|---|---|---|---|
| Target | Actual | ||
| Calibration 1 | 1,426,976 | ||
| Calibration 2 | 1,423,213 | ||
| Calibration 3 | 1,423,092 | ||
| ssj_ops@calibrated=1,423,152 | |||
| 100% | 99.6% | 1,423,152 | 1,418,161 |
| 90% | 89.9% | 1,280,837 | 1,280,032 |
| 80% | 80.1% | 1,138,522 | 1,139,704 |
| 70% | 69.9% | 996,207 | 995,372 |
| 60% | 59.9% | 853,891 | 852,488 |
| 50% | 49.9% | 711,576 | 710,406 |
| 40% | 40.0% | 569,261 | 569,315 |
| 30% | 30.0% | 426,946 | 426,326 |
| 20% | 20.2% | 284,630 | 287,101 |
| 10% | 9.9% | 142,315 | 140,528 |
| Active Idle | 0 | 0 | |
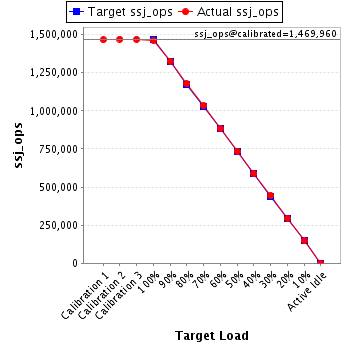
| Target Load | Actual Load | ssj_ops | |
|---|---|---|---|
| Target | Actual | ||
| Calibration 1 | 1,465,559 | ||
| Calibration 2 | 1,470,352 | ||
| Calibration 3 | 1,469,567 | ||
| ssj_ops@calibrated=1,469,960 | |||
| 100% | 99.6% | 1,469,960 | 1,464,002 |
| 90% | 90.3% | 1,322,964 | 1,326,985 |
| 80% | 80.1% | 1,175,968 | 1,176,894 |
| 70% | 70.4% | 1,028,972 | 1,034,522 |
| 60% | 60.1% | 881,976 | 883,874 |
| 50% | 50.1% | 734,980 | 735,836 |
| 40% | 40.0% | 587,984 | 587,815 |
| 30% | 30.2% | 440,988 | 443,964 |
| 20% | 20.0% | 293,992 | 294,496 |
| 10% | 10.1% | 146,996 | 148,372 |
| Active Idle | 0 | 0 | |
| Target Load | Actual Load | ssj_ops | |
|---|---|---|---|
| Target | Actual | ||
| Calibration 1 | 1,439,127 | ||
| Calibration 2 | 1,438,688 | ||
| Calibration 3 | 1,438,532 | ||
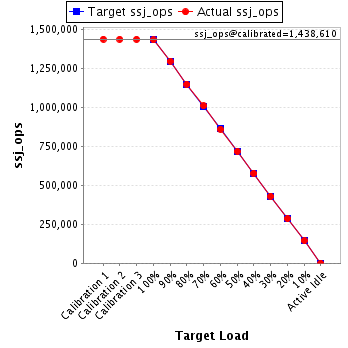
| ssj_ops@calibrated=1,438,610 | |||
| 100% | 99.7% | 1,438,610 | 1,433,794 |
| 90% | 90.2% | 1,294,749 | 1,297,727 |
| 80% | 79.9% | 1,150,888 | 1,149,442 |
| 70% | 70.2% | 1,007,027 | 1,010,453 |
| 60% | 59.9% | 863,166 | 861,282 |
| 50% | 49.9% | 719,305 | 718,442 |
| 40% | 40.1% | 575,444 | 577,322 |
| 30% | 30.0% | 431,583 | 430,931 |
| 20% | 19.9% | 287,722 | 286,131 |
| 10% | 10.1% | 143,861 | 145,043 |
| Active Idle | 0 | 0 | |