SPECpower_ssj2008
Host 'NODE03' Performance Report
Copyright © 2007-2019 Standard Performance Evaluation Corporation
| Hewlett Packard Enterprise Synergy 480 Gen10 Compute Module | ssj_ops@100% = 5,764,439 ssj_ops@100% per JVM = 1,441,110 |
||||
| Test Sponsor: | Hewlett Packard Enterprise | SPEC License #: | 3 | Test Method: | Multi Node |
| Tested By: | Hewlett Packard Enterprise | Test Location: | Houston, TX, USA | Test Date: | Mar 26, 2019 |
| Hardware Availability: | Apr-2019 | Software Availability: | Mar-2019 | Publication: | May 8, 2019 |
| System Source: | Single Supplier | System Designation: | Server | Power Provisioning: | Line-powered |
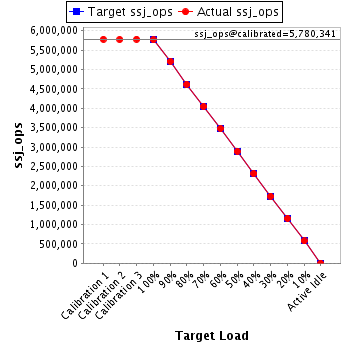
| Target Load | Actual Load | ssj_ops | |
|---|---|---|---|
| Target | Actual | ||
| Calibration 1 | 5,782,188 | ||
| Calibration 2 | 5,776,534 | ||
| Calibration 3 | 5,784,149 | ||
| ssj_ops@calibrated=5,780,341 | |||
| 100% | 99.7% | 5,780,341 | 5,764,439 |
| 90% | 90.1% | 5,202,307 | 5,209,513 |
| 80% | 79.9% | 4,624,273 | 4,616,102 |
| 70% | 70.1% | 4,046,239 | 4,050,948 |
| 60% | 60.1% | 3,468,205 | 3,474,064 |
| 50% | 50.0% | 2,890,171 | 2,889,977 |
| 40% | 40.0% | 2,312,136 | 2,311,034 |
| 30% | 30.0% | 1,734,102 | 1,732,351 |
| 20% | 20.0% | 1,156,068 | 1,157,864 |
| 10% | 10.0% | 578,034 | 575,952 |
| Active Idle | 0 | 0 | |
| Set Identifier: | SUT |
| Set Description: | System Under Test |
| # of Identical Nodes: | 7 |
| Comment: | SUT |
| Hardware | |
|---|---|
| Hardware Vendor: | Hewlett Packard Enterprise |
| Model: | Synergy 480 Gen10 Compute Module |
| Form Factor: | 7U |
| CPU Name: | Intel Xeon Platinum 8280 @ 2.70GHz (Intel Turbo Boost Technology up to 4.00 GHz) |
| CPU Characteristics: | 28-Core, 2.70 GHz, 38.5MB L3 Cache |
| CPU Frequency (MHz): | 2700 |
| CPU(s) Enabled: | 56 cores, 2 chips, 28 cores/chip |
| Hardware Threads: | 112 (2 / core) |
| CPU(s) Orderable: | 1,2 chips |
| Primary Cache: | 32 KB I + 32 KB D on chip per core |
| Secondary Cache: | 1 MB I+D on chip per core |
| Tertiary Cache: | 39424 KB I+D on chip per chip |
| Other Cache: | None |
| Memory Amount (GB): | 192 |
| # and size of DIMM: | 12 x 16384 MB |
| Memory Details: | 12 x 16GB 2Rx8 PC4-2933Y-R; slots 1, 3, 5, 8, 10 and 12 populated in each socket |
| Power Supply Quantity and Rating (W): | None |
| Power Supply Details: | N/A |
| Disk Drive: | 1 x HPE 240GB 6G SATA M.2 SSD (875488-B21) |
| Disk Controller: | HPE Smart Array S100i SR Gen10 |
| # and type of Network Interface Cards (NICs) Installed: | 1 x HPE Synergy 3820C 10/20Gb CNA |
| NICs Enabled in Firmware / OS / Connected: | 2/2/1 |
| Network Speed (Mbit): | 1000 |
| Keyboard: | None |
| Mouse: | None |
| Monitor: | None |
| Optical Drives: | No |
| Other Hardware: | H/S: Standard |
| Software | |
|---|---|
| Power Management: | Enabled (see SUT Notes) |
| Operating System (OS): | Windows Server 2012 R2 Datacenter |
| OS Version: | Version 6.3 (Build 9600) |
| Filesystem: | NTFS |
| JVM Vendor: | Oracle Corporation |
| JVM Version: | Oracle Java HotSpot(TM) 64-Bit Server VM (build 24.80-b11, mixed mode), version 1.7.0_80 |
| JVM Command-line Options: | -server -Xmn21000m -Xms24000m -Xmx24000m -XX:SurvivorRatio=1 -XX:TargetSurvivorRatio=99 -XX:AllocatePrefetchDistance=256 -XX:AllocatePrefetchLines=4 -XX:LoopUnrollLimit=45 -XX:InitialTenuringThreshold=12 -XX:MaxTenuringThreshold=15 -XX:ParallelGCThreads=28 -XX:InlineSmallCode=3900 -XX:MaxInlineSize=270 -XX:FreqInlineSize=2500 -XX:+AggressiveOpts -XX:+UseLargePages -XX:+UseParallelOldGC |
| JVM Affinity: | start /NODE [0,1,2,3] /AFFINITY [0xFFFFFFF] |
| JVM Instances: | 4 |
| JVM Initial Heap (MB): | 21000 |
| JVM Maximum Heap (MB): | 21000 |
| JVM Address Bits: | 64 |
| Boot Firmware Version: | I42 v2.00 (02/02/2019) |
| Management Firmware Version: | 1.40 Feb 05 2019 |
| Workload Version: | SSJ 1.2.10 |
| Director Location: | Controller |
| Other Software: | HPE Service Pack for ProLiant (SPP) Version: 2019.03.0, Microsoft Windows KB4056898, KB4338815 |
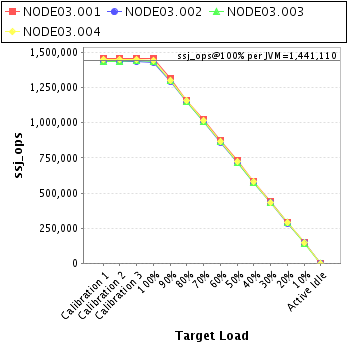
| JVM Instance | ssj_ops@100% |
|---|---|
| NODE03.001 | 1,453,723 |
| NODE03.002 | 1,429,313 |
| NODE03.003 | 1,436,323 |
| NODE03.004 | 1,445,079 |
| ssj_ops@100% | 5,764,439 |
| ssj_ops@100% per JVM | 1,441,110 |
| Target Load | Actual Load | ssj_ops | |
|---|---|---|---|
| Target | Actual | ||
| Calibration 1 | 1,458,699 | ||
| Calibration 2 | 1,456,878 | ||
| Calibration 3 | 1,459,474 | ||
| ssj_ops@calibrated=1,458,176 | |||
| 100% | 99.7% | 1,458,176 | 1,453,723 |
| 90% | 90.1% | 1,312,359 | 1,314,439 |
| 80% | 79.7% | 1,166,541 | 1,161,819 |
| 70% | 70.0% | 1,020,723 | 1,020,066 |
| 60% | 60.1% | 874,906 | 876,897 |
| 50% | 49.9% | 729,088 | 727,816 |
| 40% | 39.9% | 583,270 | 582,191 |
| 30% | 29.9% | 437,453 | 436,563 |
| 20% | 20.1% | 291,635 | 292,655 |
| 10% | 9.9% | 145,818 | 145,031 |
| Active Idle | 0 | 0 | |
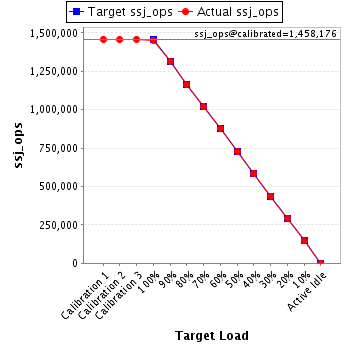
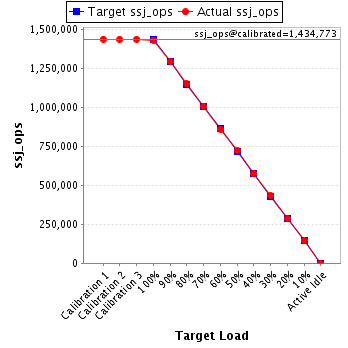
| Target Load | Actual Load | ssj_ops | |
|---|---|---|---|
| Target | Actual | ||
| Calibration 1 | 1,435,974 | ||
| Calibration 2 | 1,434,285 | ||
| Calibration 3 | 1,435,260 | ||
| ssj_ops@calibrated=1,434,773 | |||
| 100% | 99.6% | 1,434,773 | 1,429,313 |
| 90% | 90.1% | 1,291,295 | 1,292,779 |
| 80% | 80.1% | 1,147,818 | 1,148,953 |
| 70% | 70.1% | 1,004,341 | 1,005,917 |
| 60% | 60.0% | 860,864 | 860,218 |
| 50% | 50.2% | 717,386 | 719,910 |
| 40% | 39.9% | 573,909 | 572,367 |
| 30% | 30.1% | 430,432 | 431,478 |
| 20% | 19.9% | 286,955 | 285,547 |
| 10% | 10.1% | 143,477 | 144,442 |
| Active Idle | 0 | 0 | |
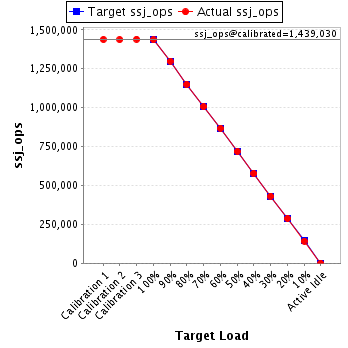
| Target Load | Actual Load | ssj_ops | |
|---|---|---|---|
| Target | Actual | ||
| Calibration 1 | 1,438,349 | ||
| Calibration 2 | 1,437,539 | ||
| Calibration 3 | 1,440,521 | ||
| ssj_ops@calibrated=1,439,030 | |||
| 100% | 99.8% | 1,439,030 | 1,436,323 |
| 90% | 90.3% | 1,295,127 | 1,299,499 |
| 80% | 79.9% | 1,151,224 | 1,149,681 |
| 70% | 69.9% | 1,007,321 | 1,006,513 |
| 60% | 60.3% | 863,418 | 868,376 |
| 50% | 50.0% | 719,515 | 718,938 |
| 40% | 40.1% | 575,612 | 576,986 |
| 30% | 30.0% | 431,709 | 432,102 |
| 20% | 20.0% | 287,806 | 287,418 |
| 10% | 9.9% | 143,903 | 142,260 |
| Active Idle | 0 | 0 | |
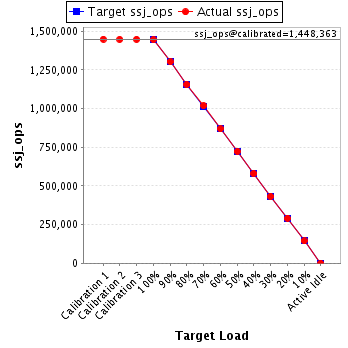
| Target Load | Actual Load | ssj_ops | |
|---|---|---|---|
| Target | Actual | ||
| Calibration 1 | 1,449,166 | ||
| Calibration 2 | 1,447,832 | ||
| Calibration 3 | 1,448,894 | ||
| ssj_ops@calibrated=1,448,363 | |||
| 100% | 99.8% | 1,448,363 | 1,445,079 |
| 90% | 89.9% | 1,303,526 | 1,302,797 |
| 80% | 79.8% | 1,158,690 | 1,155,649 |
| 70% | 70.3% | 1,013,854 | 1,018,452 |
| 60% | 60.0% | 869,018 | 868,573 |
| 50% | 49.9% | 724,181 | 723,313 |
| 40% | 40.0% | 579,345 | 579,490 |
| 30% | 29.8% | 434,509 | 432,208 |
| 20% | 20.2% | 289,673 | 292,244 |
| 10% | 10.0% | 144,836 | 144,219 |
| Active Idle | 0 | 0 | |