SPECpower_ssj2008
Host 'NODE05' Performance Report
Copyright © 2007-2019 Standard Performance Evaluation Corporation
| Hewlett Packard Enterprise Synergy 480 Gen10 Compute Module | ssj_ops@100% = 5,742,436 ssj_ops@100% per JVM = 1,435,609 |
||||
| Test Sponsor: | Hewlett Packard Enterprise | SPEC License #: | 3 | Test Method: | Multi Node |
| Tested By: | Hewlett Packard Enterprise | Test Location: | Houston, TX, USA | Test Date: | Mar 26, 2019 |
| Hardware Availability: | Apr-2019 | Software Availability: | Mar-2019 | Publication: | May 8, 2019 |
| System Source: | Single Supplier | System Designation: | Server | Power Provisioning: | Line-powered |
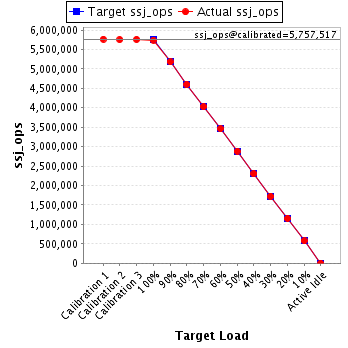
| Target Load | Actual Load | ssj_ops | |
|---|---|---|---|
| Target | Actual | ||
| Calibration 1 | 5,764,944 | ||
| Calibration 2 | 5,753,847 | ||
| Calibration 3 | 5,761,188 | ||
| ssj_ops@calibrated=5,757,517 | |||
| 100% | 99.7% | 5,757,517 | 5,742,436 |
| 90% | 90.0% | 5,181,766 | 5,180,193 |
| 80% | 79.9% | 4,606,014 | 4,602,675 |
| 70% | 70.0% | 4,030,262 | 4,027,924 |
| 60% | 60.0% | 3,454,510 | 3,456,111 |
| 50% | 50.1% | 2,878,759 | 2,884,013 |
| 40% | 40.0% | 2,303,007 | 2,300,602 |
| 30% | 29.9% | 1,727,255 | 1,723,164 |
| 20% | 20.0% | 1,151,503 | 1,153,884 |
| 10% | 10.0% | 575,752 | 576,981 |
| Active Idle | 0 | 0 | |
| Set Identifier: | SUT |
| Set Description: | System Under Test |
| # of Identical Nodes: | 7 |
| Comment: | SUT |
| Hardware | |
|---|---|
| Hardware Vendor: | Hewlett Packard Enterprise |
| Model: | Synergy 480 Gen10 Compute Module |
| Form Factor: | 7U |
| CPU Name: | Intel Xeon Platinum 8280 @ 2.70GHz (Intel Turbo Boost Technology up to 4.00 GHz) |
| CPU Characteristics: | 28-Core, 2.70 GHz, 38.5MB L3 Cache |
| CPU Frequency (MHz): | 2700 |
| CPU(s) Enabled: | 56 cores, 2 chips, 28 cores/chip |
| Hardware Threads: | 112 (2 / core) |
| CPU(s) Orderable: | 1,2 chips |
| Primary Cache: | 32 KB I + 32 KB D on chip per core |
| Secondary Cache: | 1 MB I+D on chip per core |
| Tertiary Cache: | 39424 KB I+D on chip per chip |
| Other Cache: | None |
| Memory Amount (GB): | 192 |
| # and size of DIMM: | 12 x 16384 MB |
| Memory Details: | 12 x 16GB 2Rx8 PC4-2933Y-R; slots 1, 3, 5, 8, 10 and 12 populated in each socket |
| Power Supply Quantity and Rating (W): | None |
| Power Supply Details: | N/A |
| Disk Drive: | 1 x HPE 240GB 6G SATA M.2 SSD (875488-B21) |
| Disk Controller: | HPE Smart Array S100i SR Gen10 |
| # and type of Network Interface Cards (NICs) Installed: | 1 x HPE Synergy 3820C 10/20Gb CNA |
| NICs Enabled in Firmware / OS / Connected: | 2/2/1 |
| Network Speed (Mbit): | 1000 |
| Keyboard: | None |
| Mouse: | None |
| Monitor: | None |
| Optical Drives: | No |
| Other Hardware: | H/S: Standard |
| Software | |
|---|---|
| Power Management: | Enabled (see SUT Notes) |
| Operating System (OS): | Windows Server 2012 R2 Datacenter |
| OS Version: | Version 6.3 (Build 9600) |
| Filesystem: | NTFS |
| JVM Vendor: | Oracle Corporation |
| JVM Version: | Oracle Java HotSpot(TM) 64-Bit Server VM (build 24.80-b11, mixed mode), version 1.7.0_80 |
| JVM Command-line Options: | -server -Xmn21000m -Xms24000m -Xmx24000m -XX:SurvivorRatio=1 -XX:TargetSurvivorRatio=99 -XX:AllocatePrefetchDistance=256 -XX:AllocatePrefetchLines=4 -XX:LoopUnrollLimit=45 -XX:InitialTenuringThreshold=12 -XX:MaxTenuringThreshold=15 -XX:ParallelGCThreads=28 -XX:InlineSmallCode=3900 -XX:MaxInlineSize=270 -XX:FreqInlineSize=2500 -XX:+AggressiveOpts -XX:+UseLargePages -XX:+UseParallelOldGC |
| JVM Affinity: | start /NODE [0,1,2,3] /AFFINITY [0xFFFFFFF] |
| JVM Instances: | 4 |
| JVM Initial Heap (MB): | 21000 |
| JVM Maximum Heap (MB): | 21000 |
| JVM Address Bits: | 64 |
| Boot Firmware Version: | I42 v2.00 (02/02/2019) |
| Management Firmware Version: | 1.40 Feb 05 2019 |
| Workload Version: | SSJ 1.2.10 |
| Director Location: | Controller |
| Other Software: | HPE Service Pack for ProLiant (SPP) Version: 2019.03.0, Microsoft Windows KB4056898, KB4338815 |
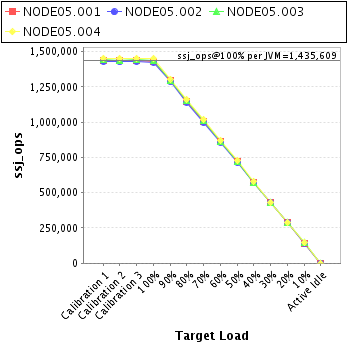
| JVM Instance | ssj_ops@100% |
|---|---|
| NODE05.001 | 1,432,301 |
| NODE05.002 | 1,425,009 |
| NODE05.003 | 1,436,239 |
| NODE05.004 | 1,448,888 |
| ssj_ops@100% | 5,742,436 |
| ssj_ops@100% per JVM | 1,435,609 |
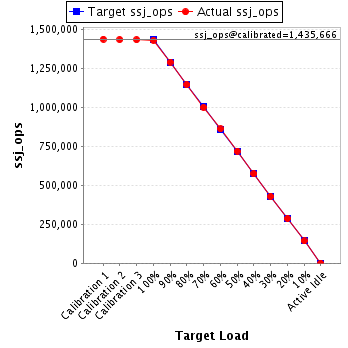
| Target Load | Actual Load | ssj_ops | |
|---|---|---|---|
| Target | Actual | ||
| Calibration 1 | 1,439,542 | ||
| Calibration 2 | 1,436,221 | ||
| Calibration 3 | 1,435,111 | ||
| ssj_ops@calibrated=1,435,666 | |||
| 100% | 99.8% | 1,435,666 | 1,432,301 |
| 90% | 90.1% | 1,292,100 | 1,292,843 |
| 80% | 79.9% | 1,148,533 | 1,147,321 |
| 70% | 69.8% | 1,004,966 | 1,002,403 |
| 60% | 60.1% | 861,400 | 862,574 |
| 50% | 50.2% | 717,833 | 720,579 |
| 40% | 40.0% | 574,267 | 574,492 |
| 30% | 29.9% | 430,700 | 429,275 |
| 20% | 20.0% | 287,133 | 286,601 |
| 10% | 10.0% | 143,567 | 143,340 |
| Active Idle | 0 | 0 | |
| Target Load | Actual Load | ssj_ops | |
|---|---|---|---|
| Target | Actual | ||
| Calibration 1 | 1,431,455 | ||
| Calibration 2 | 1,426,557 | ||
| Calibration 3 | 1,431,361 | ||
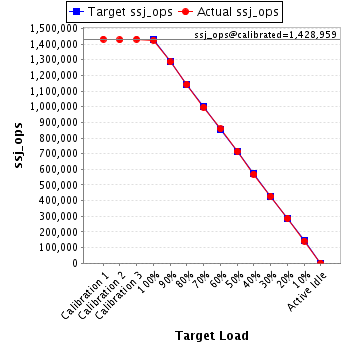
| ssj_ops@calibrated=1,428,959 | |||
| 100% | 99.7% | 1,428,959 | 1,425,009 |
| 90% | 90.0% | 1,286,063 | 1,286,135 |
| 80% | 79.9% | 1,143,167 | 1,142,009 |
| 70% | 69.8% | 1,000,271 | 997,534 |
| 60% | 60.0% | 857,376 | 857,915 |
| 50% | 50.0% | 714,480 | 714,498 |
| 40% | 39.9% | 571,584 | 569,574 |
| 30% | 30.0% | 428,688 | 428,083 |
| 20% | 20.1% | 285,792 | 286,921 |
| 10% | 9.9% | 142,896 | 142,166 |
| Active Idle | 0 | 0 | |
| Target Load | Actual Load | ssj_ops | |
|---|---|---|---|
| Target | Actual | ||
| Calibration 1 | 1,440,605 | ||
| Calibration 2 | 1,439,656 | ||
| Calibration 3 | 1,441,379 | ||
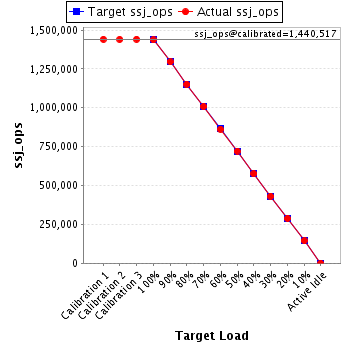
| ssj_ops@calibrated=1,440,517 | |||
| 100% | 99.7% | 1,440,517 | 1,436,239 |
| 90% | 89.9% | 1,296,466 | 1,295,712 |
| 80% | 79.9% | 1,152,414 | 1,151,582 |
| 70% | 70.0% | 1,008,362 | 1,008,791 |
| 60% | 59.9% | 864,310 | 863,082 |
| 50% | 50.1% | 720,259 | 721,708 |
| 40% | 39.9% | 576,207 | 575,197 |
| 30% | 30.0% | 432,155 | 432,015 |
| 20% | 20.0% | 288,103 | 288,728 |
| 10% | 10.0% | 144,052 | 144,679 |
| Active Idle | 0 | 0 | |
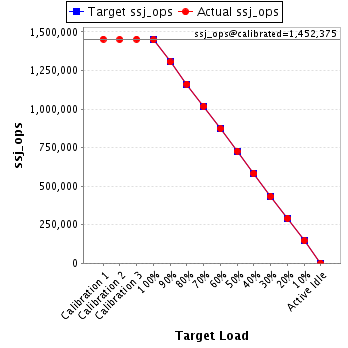
| Target Load | Actual Load | ssj_ops | |
|---|---|---|---|
| Target | Actual | ||
| Calibration 1 | 1,453,343 | ||
| Calibration 2 | 1,451,412 | ||
| Calibration 3 | 1,453,337 | ||
| ssj_ops@calibrated=1,452,375 | |||
| 100% | 99.8% | 1,452,375 | 1,448,888 |
| 90% | 89.9% | 1,307,137 | 1,305,504 |
| 80% | 80.0% | 1,161,900 | 1,161,763 |
| 70% | 70.2% | 1,016,662 | 1,019,197 |
| 60% | 60.1% | 871,425 | 872,540 |
| 50% | 50.1% | 726,187 | 727,228 |
| 40% | 40.0% | 580,950 | 581,340 |
| 30% | 29.9% | 435,712 | 433,791 |
| 20% | 20.1% | 290,475 | 291,634 |
| 10% | 10.1% | 145,237 | 146,796 |
| Active Idle | 0 | 0 | |