SPECpower_ssj2008
Host 'NODE07' Performance Report
Copyright © 2007-2019 Standard Performance Evaluation Corporation
| Hewlett Packard Enterprise Synergy 480 Gen10 Compute Module | ssj_ops@100% = 5,751,844 ssj_ops@100% per JVM = 1,437,961 |
||||
| Test Sponsor: | Hewlett Packard Enterprise | SPEC License #: | 3 | Test Method: | Multi Node |
| Tested By: | Hewlett Packard Enterprise | Test Location: | Houston, TX, USA | Test Date: | Mar 26, 2019 |
| Hardware Availability: | Apr-2019 | Software Availability: | Mar-2019 | Publication: | May 8, 2019 |
| System Source: | Single Supplier | System Designation: | Server | Power Provisioning: | Line-powered |
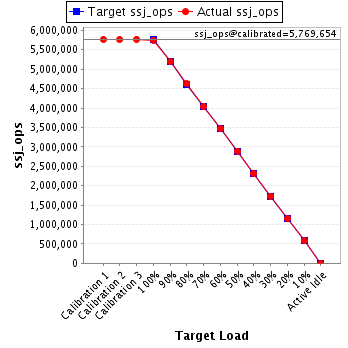
| Target Load | Actual Load | ssj_ops | |
|---|---|---|---|
| Target | Actual | ||
| Calibration 1 | 5,768,377 | ||
| Calibration 2 | 5,765,629 | ||
| Calibration 3 | 5,773,679 | ||
| ssj_ops@calibrated=5,769,654 | |||
| 100% | 99.7% | 5,769,654 | 5,751,844 |
| 90% | 90.1% | 5,192,689 | 5,195,656 |
| 80% | 80.1% | 4,615,723 | 4,619,650 |
| 70% | 70.1% | 4,038,758 | 4,042,611 |
| 60% | 60.0% | 3,461,793 | 3,462,278 |
| 50% | 50.1% | 2,884,827 | 2,892,286 |
| 40% | 40.0% | 2,307,862 | 2,307,301 |
| 30% | 30.0% | 1,730,896 | 1,731,896 |
| 20% | 20.0% | 1,153,931 | 1,154,154 |
| 10% | 10.0% | 576,965 | 574,246 |
| Active Idle | 0 | 0 | |
| Set Identifier: | SUT |
| Set Description: | System Under Test |
| # of Identical Nodes: | 7 |
| Comment: | SUT |
| Hardware | |
|---|---|
| Hardware Vendor: | Hewlett Packard Enterprise |
| Model: | Synergy 480 Gen10 Compute Module |
| Form Factor: | 7U |
| CPU Name: | Intel Xeon Platinum 8280 @ 2.70GHz (Intel Turbo Boost Technology up to 4.00 GHz) |
| CPU Characteristics: | 28-Core, 2.70 GHz, 38.5MB L3 Cache |
| CPU Frequency (MHz): | 2700 |
| CPU(s) Enabled: | 56 cores, 2 chips, 28 cores/chip |
| Hardware Threads: | 112 (2 / core) |
| CPU(s) Orderable: | 1,2 chips |
| Primary Cache: | 32 KB I + 32 KB D on chip per core |
| Secondary Cache: | 1 MB I+D on chip per core |
| Tertiary Cache: | 39424 KB I+D on chip per chip |
| Other Cache: | None |
| Memory Amount (GB): | 192 |
| # and size of DIMM: | 12 x 16384 MB |
| Memory Details: | 12 x 16GB 2Rx8 PC4-2933Y-R; slots 1, 3, 5, 8, 10 and 12 populated in each socket |
| Power Supply Quantity and Rating (W): | None |
| Power Supply Details: | N/A |
| Disk Drive: | 1 x HPE 240GB 6G SATA M.2 SSD (875488-B21) |
| Disk Controller: | HPE Smart Array S100i SR Gen10 |
| # and type of Network Interface Cards (NICs) Installed: | 1 x HPE Synergy 3820C 10/20Gb CNA |
| NICs Enabled in Firmware / OS / Connected: | 2/2/1 |
| Network Speed (Mbit): | 1000 |
| Keyboard: | None |
| Mouse: | None |
| Monitor: | None |
| Optical Drives: | No |
| Other Hardware: | H/S: Standard |
| Software | |
|---|---|
| Power Management: | Enabled (see SUT Notes) |
| Operating System (OS): | Windows Server 2012 R2 Datacenter |
| OS Version: | Version 6.3 (Build 9600) |
| Filesystem: | NTFS |
| JVM Vendor: | Oracle Corporation |
| JVM Version: | Oracle Java HotSpot(TM) 64-Bit Server VM (build 24.80-b11, mixed mode), version 1.7.0_80 |
| JVM Command-line Options: | -server -Xmn21000m -Xms24000m -Xmx24000m -XX:SurvivorRatio=1 -XX:TargetSurvivorRatio=99 -XX:AllocatePrefetchDistance=256 -XX:AllocatePrefetchLines=4 -XX:LoopUnrollLimit=45 -XX:InitialTenuringThreshold=12 -XX:MaxTenuringThreshold=15 -XX:ParallelGCThreads=28 -XX:InlineSmallCode=3900 -XX:MaxInlineSize=270 -XX:FreqInlineSize=2500 -XX:+AggressiveOpts -XX:+UseLargePages -XX:+UseParallelOldGC |
| JVM Affinity: | start /NODE [0,1,2,3] /AFFINITY [0xFFFFFFF] |
| JVM Instances: | 4 |
| JVM Initial Heap (MB): | 21000 |
| JVM Maximum Heap (MB): | 21000 |
| JVM Address Bits: | 64 |
| Boot Firmware Version: | I42 v2.00 (02/02/2019) |
| Management Firmware Version: | 1.40 Feb 05 2019 |
| Workload Version: | SSJ 1.2.10 |
| Director Location: | Controller |
| Other Software: | HPE Service Pack for ProLiant (SPP) Version: 2019.03.0, Microsoft Windows KB4056898, KB4338815 |
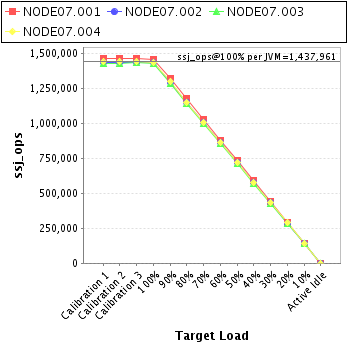
| JVM Instance | ssj_ops@100% |
|---|---|
| NODE07.001 | 1,458,637 |
| NODE07.002 | 1,432,687 |
| NODE07.003 | 1,423,794 |
| NODE07.004 | 1,436,727 |
| ssj_ops@100% | 5,751,844 |
| ssj_ops@100% per JVM | 1,437,961 |
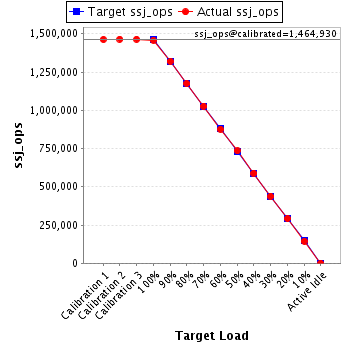
| Target Load | Actual Load | ssj_ops | |
|---|---|---|---|
| Target | Actual | ||
| Calibration 1 | 1,462,713 | ||
| Calibration 2 | 1,464,905 | ||
| Calibration 3 | 1,464,954 | ||
| ssj_ops@calibrated=1,464,930 | |||
| 100% | 99.6% | 1,464,930 | 1,458,637 |
| 90% | 90.2% | 1,318,437 | 1,320,853 |
| 80% | 80.2% | 1,171,944 | 1,174,948 |
| 70% | 70.2% | 1,025,451 | 1,027,908 |
| 60% | 59.9% | 878,958 | 877,170 |
| 50% | 50.1% | 732,465 | 734,357 |
| 40% | 40.2% | 585,972 | 588,199 |
| 30% | 29.9% | 439,479 | 438,662 |
| 20% | 19.9% | 292,986 | 292,009 |
| 10% | 9.8% | 146,493 | 143,949 |
| Active Idle | 0 | 0 | |
| Target Load | Actual Load | ssj_ops | |
|---|---|---|---|
| Target | Actual | ||
| Calibration 1 | 1,437,629 | ||
| Calibration 2 | 1,436,042 | ||
| Calibration 3 | 1,437,233 | ||
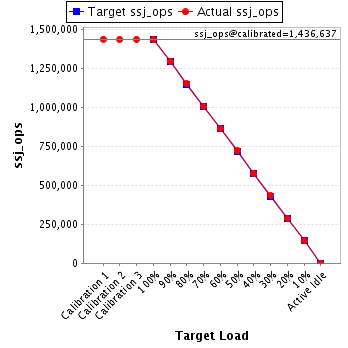
| ssj_ops@calibrated=1,436,637 | |||
| 100% | 99.7% | 1,436,637 | 1,432,687 |
| 90% | 90.1% | 1,292,974 | 1,294,199 |
| 80% | 80.2% | 1,149,310 | 1,151,542 |
| 70% | 70.0% | 1,005,646 | 1,006,159 |
| 60% | 60.0% | 861,982 | 861,466 |
| 50% | 50.2% | 718,319 | 721,309 |
| 40% | 40.0% | 574,655 | 575,264 |
| 30% | 30.2% | 430,991 | 433,901 |
| 20% | 20.0% | 287,327 | 286,771 |
| 10% | 10.0% | 143,664 | 144,121 |
| Active Idle | 0 | 0 | |
| Target Load | Actual Load | ssj_ops | |
|---|---|---|---|
| Target | Actual | ||
| Calibration 1 | 1,429,660 | ||
| Calibration 2 | 1,424,467 | ||
| Calibration 3 | 1,430,633 | ||
| ssj_ops@calibrated=1,427,550 | |||
| 100% | 99.7% | 1,427,550 | 1,423,794 |
| 90% | 89.7% | 1,284,795 | 1,280,901 |
| 80% | 80.1% | 1,142,040 | 1,142,989 |
| 70% | 70.1% | 999,285 | 1,000,592 |
| 60% | 60.2% | 856,530 | 858,776 |
| 50% | 50.1% | 713,775 | 715,360 |
| 40% | 39.8% | 571,020 | 568,392 |
| 30% | 29.9% | 428,265 | 427,222 |
| 20% | 20.1% | 285,510 | 286,840 |
| 10% | 10.0% | 142,755 | 143,023 |
| Active Idle | 0 | 0 | |

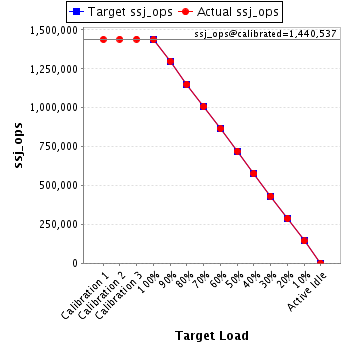
| Target Load | Actual Load | ssj_ops | |
|---|---|---|---|
| Target | Actual | ||
| Calibration 1 | 1,438,376 | ||
| Calibration 2 | 1,440,215 | ||
| Calibration 3 | 1,440,859 | ||
| ssj_ops@calibrated=1,440,537 | |||
| 100% | 99.7% | 1,440,537 | 1,436,727 |
| 90% | 90.2% | 1,296,483 | 1,299,703 |
| 80% | 79.8% | 1,152,430 | 1,150,171 |
| 70% | 70.0% | 1,008,376 | 1,007,952 |
| 60% | 60.0% | 864,322 | 864,866 |
| 50% | 50.1% | 720,269 | 721,260 |
| 40% | 39.9% | 576,215 | 575,446 |
| 30% | 30.0% | 432,161 | 432,110 |
| 20% | 20.0% | 288,107 | 288,533 |
| 10% | 9.9% | 144,054 | 143,153 |
| Active Idle | 0 | 0 | |