
SPECpower_ssj2008
Host 'NODE03' Performance Report
Copyright © 2007-2019 Standard Performance Evaluation Corporation
| Hewlett Packard Enterprise Synergy 480 Gen10 Compute Module | ssj_ops@100% = 5,738,324 ssj_ops@100% per JVM = 1,434,581 |
||||
| Test Sponsor: | Hewlett Packard Enterprise | SPEC License #: | 3 | Test Method: | Multi Node |
| Tested By: | Hewlett Packard Enterprise | Test Location: | Houston, TX, USA | Test Date: | Mar 26, 2019 |
| Hardware Availability: | Apr-2019 | Software Availability: | Mar-2019 | Publication: | May 8, 2019 |
| System Source: | Single Supplier | System Designation: | Server | Power Provisioning: | Line-powered |
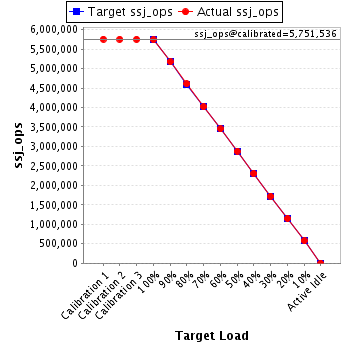
| Target Load | Actual Load | ssj_ops | |
|---|---|---|---|
| Target | Actual | ||
| Calibration 1 | 5,754,035 | ||
| Calibration 2 | 5,750,575 | ||
| Calibration 3 | 5,752,498 | ||
| ssj_ops@calibrated=5,751,536 | |||
| 100% | 99.8% | 5,751,536 | 5,738,324 |
| 90% | 90.0% | 5,176,383 | 5,174,191 |
| 80% | 80.2% | 4,601,229 | 4,610,730 |
| 70% | 69.9% | 4,026,075 | 4,020,246 |
| 60% | 59.9% | 3,450,922 | 3,447,523 |
| 50% | 50.0% | 2,875,768 | 2,878,367 |
| 40% | 40.0% | 2,300,614 | 2,301,276 |
| 30% | 30.0% | 1,725,461 | 1,725,034 |
| 20% | 20.0% | 1,150,307 | 1,149,427 |
| 10% | 10.0% | 575,154 | 576,872 |
| Active Idle | 0 | 0 | |
| Set Identifier: | SUT |
| Set Description: | System Under Test |
| # of Identical Nodes: | 6 |
| Comment: | SUT |
| Hardware | |
|---|---|
| Hardware Vendor: | Hewlett Packard Enterprise |
| Model: | Synergy 480 Gen10 Compute Module |
| Form Factor: | 7U |
| CPU Name: | Intel Xeon Platinum 8280 @ 2.70GHz (Intel Turbo Boost Technology up to 4.00 GHz) |
| CPU Characteristics: | 28-Core, 2.70 GHz, 38.5MB L3 Cache |
| CPU Frequency (MHz): | 2700 |
| CPU(s) Enabled: | 56 cores, 2 chips, 28 cores/chip |
| Hardware Threads: | 112 (2 / core) |
| CPU(s) Orderable: | 1,2 chips |
| Primary Cache: | 32 KB I + 32 KB D on chip per core |
| Secondary Cache: | 1 MB I+D on chip per core |
| Tertiary Cache: | 39424 KB I+D on chip per chip |
| Other Cache: | None |
| Memory Amount (GB): | 192 |
| # and size of DIMM: | 12 x 16384 MB |
| Memory Details: | 12 x 16GB 2Rx8 PC4-2933Y-R; slots 1, 3, 5, 8, 10 and 12 populated in each socket |
| Power Supply Quantity and Rating (W): | None |
| Power Supply Details: | N/A |
| Disk Drive: | 1 x HPE 240GB 6G SATA M.2 SSD (875488-B21) |
| Disk Controller: | HPE Smart Array S100i SR Gen10 |
| # and type of Network Interface Cards (NICs) Installed: | 1 x HPE Synergy 3820C 10/20Gb CNA |
| NICs Enabled in Firmware / OS / Connected: | 2/2/1 |
| Network Speed (Mbit): | 1000 |
| Keyboard: | None |
| Mouse: | None |
| Monitor: | None |
| Optical Drives: | No |
| Other Hardware: | H/S: Standard |
| Software | |
|---|---|
| Power Management: | Enabled (see SUT Notes) |
| Operating System (OS): | Windows Server 2012 R2 Datacenter |
| OS Version: | Version 6.3 (Build 9600) |
| Filesystem: | NTFS |
| JVM Vendor: | Oracle Corporation |
| JVM Version: | Oracle Java HotSpot(TM) 64-Bit Server VM (build 24.80-b11, mixed mode), version 1.7.0_80 |
| JVM Command-line Options: | -server -Xmn21000m -Xms24000m -Xmx24000m -XX:SurvivorRatio=1 -XX:TargetSurvivorRatio=99 -XX:AllocatePrefetchDistance=256 -XX:AllocatePrefetchLines=4 -XX:LoopUnrollLimit=45 -XX:InitialTenuringThreshold=12 -XX:MaxTenuringThreshold=15 -XX:ParallelGCThreads=28 -XX:InlineSmallCode=3900 -XX:MaxInlineSize=270 -XX:FreqInlineSize=2500 -XX:+AggressiveOpts -XX:+UseLargePages -XX:+UseParallelOldGC |
| JVM Affinity: | start /NODE [0,1,2,3] /AFFINITY [0xFFFFFFF] |
| JVM Instances: | 4 |
| JVM Initial Heap (MB): | 24000 |
| JVM Maximum Heap (MB): | 24000 |
| JVM Address Bits: | 64 |
| Boot Firmware Version: | I42 v2.00 (02/02/2019) |
| Management Firmware Version: | 1.40 Feb 05 2019 |
| Workload Version: | SSJ 1.2.10 |
| Director Location: | Controller |
| Other Software: | HPE Service Pack for ProLiant (SPP) Version: 2019.03.0, Microsoft Windows KB4056898, KB4338815 |
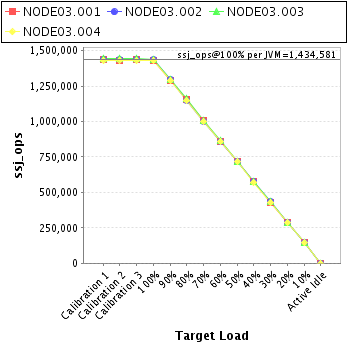
| JVM Instance | ssj_ops@100% |
|---|---|
| NODE03.001 | 1,431,761 |
| NODE03.002 | 1,435,156 |
| NODE03.003 | 1,440,312 |
| NODE03.004 | 1,431,095 |
| ssj_ops@100% | 5,738,324 |
| ssj_ops@100% per JVM | 1,434,581 |
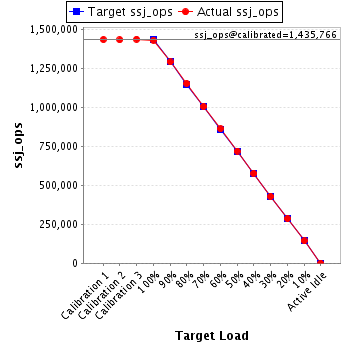
| Target Load | Actual Load | ssj_ops | |
|---|---|---|---|
| Target | Actual | ||
| Calibration 1 | 1,434,963 | ||
| Calibration 2 | 1,433,446 | ||
| Calibration 3 | 1,438,086 | ||
| ssj_ops@calibrated=1,435,766 | |||
| 100% | 99.7% | 1,435,766 | 1,431,761 |
| 90% | 90.0% | 1,292,190 | 1,291,858 |
| 80% | 80.4% | 1,148,613 | 1,154,095 |
| 70% | 70.1% | 1,005,036 | 1,006,366 |
| 60% | 60.1% | 861,460 | 862,610 |
| 50% | 50.2% | 717,883 | 720,375 |
| 40% | 40.1% | 574,307 | 575,885 |
| 30% | 29.8% | 430,730 | 428,160 |
| 20% | 19.9% | 287,153 | 285,571 |
| 10% | 10.0% | 143,577 | 144,034 |
| Active Idle | 0 | 0 | |
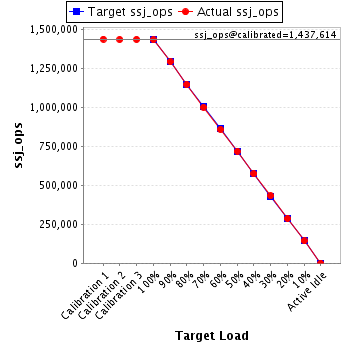
| Target Load | Actual Load | ssj_ops | |
|---|---|---|---|
| Target | Actual | ||
| Calibration 1 | 1,439,312 | ||
| Calibration 2 | 1,437,105 | ||
| Calibration 3 | 1,438,123 | ||
| ssj_ops@calibrated=1,437,614 | |||
| 100% | 99.8% | 1,437,614 | 1,435,156 |
| 90% | 90.0% | 1,293,853 | 1,294,119 |
| 80% | 79.9% | 1,150,091 | 1,148,359 |
| 70% | 69.8% | 1,006,330 | 1,002,896 |
| 60% | 59.8% | 862,568 | 859,891 |
| 50% | 50.1% | 718,807 | 719,625 |
| 40% | 40.0% | 575,046 | 574,336 |
| 30% | 30.1% | 431,284 | 432,963 |
| 20% | 19.9% | 287,523 | 286,796 |
| 10% | 10.0% | 143,761 | 143,465 |
| Active Idle | 0 | 0 | |
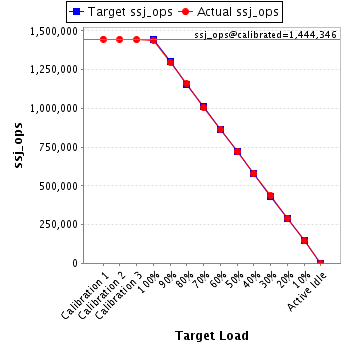
| Target Load | Actual Load | ssj_ops | |
|---|---|---|---|
| Target | Actual | ||
| Calibration 1 | 1,447,234 | ||
| Calibration 2 | 1,445,788 | ||
| Calibration 3 | 1,442,905 | ||
| ssj_ops@calibrated=1,444,346 | |||
| 100% | 99.7% | 1,444,346 | 1,440,312 |
| 90% | 89.8% | 1,299,912 | 1,297,740 |
| 80% | 80.3% | 1,155,477 | 1,159,539 |
| 70% | 69.7% | 1,011,043 | 1,007,269 |
| 60% | 59.9% | 866,608 | 864,888 |
| 50% | 49.9% | 722,173 | 720,183 |
| 40% | 40.0% | 577,739 | 578,394 |
| 30% | 30.1% | 433,304 | 434,486 |
| 20% | 20.0% | 288,869 | 289,045 |
| 10% | 10.0% | 144,435 | 144,698 |
| Active Idle | 0 | 0 | |
| Target Load | Actual Load | ssj_ops | |
|---|---|---|---|
| Target | Actual | ||
| Calibration 1 | 1,432,526 | ||
| Calibration 2 | 1,434,235 | ||
| Calibration 3 | 1,433,383 | ||
| ssj_ops@calibrated=1,433,809 | |||
| 100% | 99.8% | 1,433,809 | 1,431,095 |
| 90% | 90.0% | 1,290,429 | 1,290,475 |
| 80% | 80.1% | 1,147,048 | 1,148,736 |
| 70% | 70.0% | 1,003,667 | 1,003,715 |
| 60% | 60.0% | 860,286 | 860,134 |
| 50% | 50.1% | 716,905 | 718,184 |
| 40% | 39.9% | 573,524 | 572,661 |
| 30% | 29.9% | 430,143 | 429,425 |
| 20% | 20.1% | 286,762 | 288,014 |
| 10% | 10.1% | 143,381 | 144,674 |
| Active Idle | 0 | 0 | |
