SPECpower_ssj2008
Host 'NODE04' Performance Report
Copyright © 2007-2019 Standard Performance Evaluation Corporation
| Hewlett Packard Enterprise Synergy 480 Gen10 Compute Module | ssj_ops@100% = 5,769,683 ssj_ops@100% per JVM = 1,442,421 |
||||
| Test Sponsor: | Hewlett Packard Enterprise | SPEC License #: | 3 | Test Method: | Multi Node |
| Tested By: | Hewlett Packard Enterprise | Test Location: | Houston, TX, USA | Test Date: | Mar 26, 2019 |
| Hardware Availability: | Apr-2019 | Software Availability: | Mar-2019 | Publication: | May 8, 2019 |
| System Source: | Single Supplier | System Designation: | Server | Power Provisioning: | Line-powered |
| Target Load | Actual Load | ssj_ops | |
|---|---|---|---|
| Target | Actual | ||
| Calibration 1 | 5,780,723 | ||
| Calibration 2 | 5,779,647 | ||
| Calibration 3 | 5,780,816 | ||
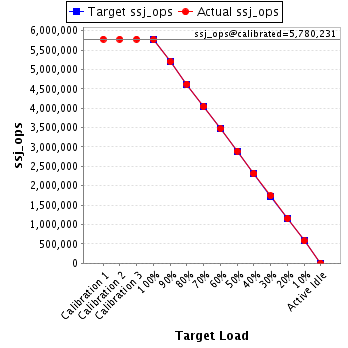
| ssj_ops@calibrated=5,780,231 | |||
| 100% | 99.8% | 5,780,231 | 5,769,683 |
| 90% | 90.0% | 5,202,208 | 5,200,215 |
| 80% | 80.0% | 4,624,185 | 4,621,360 |
| 70% | 70.0% | 4,046,162 | 4,046,093 |
| 60% | 60.0% | 3,468,139 | 3,468,995 |
| 50% | 50.1% | 2,890,116 | 2,894,261 |
| 40% | 40.0% | 2,312,092 | 2,310,788 |
| 30% | 30.1% | 1,734,069 | 1,737,221 |
| 20% | 20.0% | 1,156,046 | 1,157,389 |
| 10% | 10.0% | 578,023 | 578,337 |
| Active Idle | 0 | 0 | |
| Set Identifier: | SUT |
| Set Description: | System Under Test |
| # of Identical Nodes: | 6 |
| Comment: | SUT |
| Hardware | |
|---|---|
| Hardware Vendor: | Hewlett Packard Enterprise |
| Model: | Synergy 480 Gen10 Compute Module |
| Form Factor: | 7U |
| CPU Name: | Intel Xeon Platinum 8280 @ 2.70GHz (Intel Turbo Boost Technology up to 4.00 GHz) |
| CPU Characteristics: | 28-Core, 2.70 GHz, 38.5MB L3 Cache |
| CPU Frequency (MHz): | 2700 |
| CPU(s) Enabled: | 56 cores, 2 chips, 28 cores/chip |
| Hardware Threads: | 112 (2 / core) |
| CPU(s) Orderable: | 1,2 chips |
| Primary Cache: | 32 KB I + 32 KB D on chip per core |
| Secondary Cache: | 1 MB I+D on chip per core |
| Tertiary Cache: | 39424 KB I+D on chip per chip |
| Other Cache: | None |
| Memory Amount (GB): | 192 |
| # and size of DIMM: | 12 x 16384 MB |
| Memory Details: | 12 x 16GB 2Rx8 PC4-2933Y-R; slots 1, 3, 5, 8, 10 and 12 populated in each socket |
| Power Supply Quantity and Rating (W): | None |
| Power Supply Details: | N/A |
| Disk Drive: | 1 x HPE 240GB 6G SATA M.2 SSD (875488-B21) |
| Disk Controller: | HPE Smart Array S100i SR Gen10 |
| # and type of Network Interface Cards (NICs) Installed: | 1 x HPE Synergy 3820C 10/20Gb CNA |
| NICs Enabled in Firmware / OS / Connected: | 2/2/1 |
| Network Speed (Mbit): | 1000 |
| Keyboard: | None |
| Mouse: | None |
| Monitor: | None |
| Optical Drives: | No |
| Other Hardware: | H/S: Standard |
| Software | |
|---|---|
| Power Management: | Enabled (see SUT Notes) |
| Operating System (OS): | Windows Server 2012 R2 Datacenter |
| OS Version: | Version 6.3 (Build 9600) |
| Filesystem: | NTFS |
| JVM Vendor: | Oracle Corporation |
| JVM Version: | Oracle Java HotSpot(TM) 64-Bit Server VM (build 24.80-b11, mixed mode), version 1.7.0_80 |
| JVM Command-line Options: | -server -Xmn21000m -Xms24000m -Xmx24000m -XX:SurvivorRatio=1 -XX:TargetSurvivorRatio=99 -XX:AllocatePrefetchDistance=256 -XX:AllocatePrefetchLines=4 -XX:LoopUnrollLimit=45 -XX:InitialTenuringThreshold=12 -XX:MaxTenuringThreshold=15 -XX:ParallelGCThreads=28 -XX:InlineSmallCode=3900 -XX:MaxInlineSize=270 -XX:FreqInlineSize=2500 -XX:+AggressiveOpts -XX:+UseLargePages -XX:+UseParallelOldGC |
| JVM Affinity: | start /NODE [0,1,2,3] /AFFINITY [0xFFFFFFF] |
| JVM Instances: | 4 |
| JVM Initial Heap (MB): | 24000 |
| JVM Maximum Heap (MB): | 24000 |
| JVM Address Bits: | 64 |
| Boot Firmware Version: | I42 v2.00 (02/02/2019) |
| Management Firmware Version: | 1.40 Feb 05 2019 |
| Workload Version: | SSJ 1.2.10 |
| Director Location: | Controller |
| Other Software: | HPE Service Pack for ProLiant (SPP) Version: 2019.03.0, Microsoft Windows KB4056898, KB4338815 |
| JVM Instance | ssj_ops@100% |
|---|---|
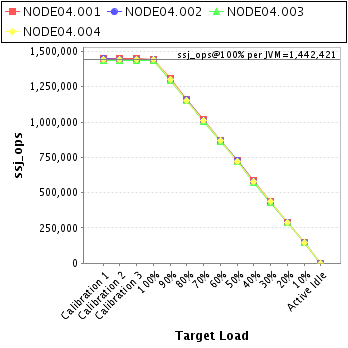
| NODE04.001 | 1,446,141 |
| NODE04.002 | 1,443,022 |
| NODE04.003 | 1,436,444 |
| NODE04.004 | 1,444,076 |
| ssj_ops@100% | 5,769,683 |
| ssj_ops@100% per JVM | 1,442,421 |
| Target Load | Actual Load | ssj_ops | |
|---|---|---|---|
| Target | Actual | ||
| Calibration 1 | 1,452,203 | ||
| Calibration 2 | 1,450,516 | ||
| Calibration 3 | 1,451,097 | ||
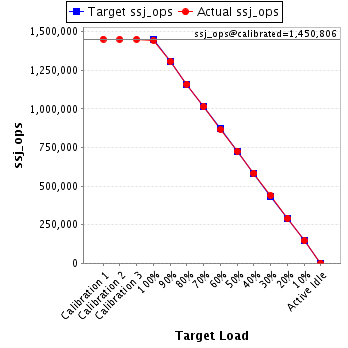
| ssj_ops@calibrated=1,450,806 | |||
| 100% | 99.7% | 1,450,806 | 1,446,141 |
| 90% | 90.2% | 1,305,726 | 1,308,012 |
| 80% | 79.9% | 1,160,645 | 1,159,774 |
| 70% | 70.0% | 1,015,565 | 1,014,965 |
| 60% | 59.8% | 870,484 | 867,196 |
| 50% | 50.1% | 725,403 | 726,683 |
| 40% | 40.2% | 580,323 | 583,640 |
| 30% | 30.2% | 435,242 | 438,054 |
| 20% | 20.0% | 290,161 | 290,628 |
| 10% | 10.1% | 145,081 | 146,418 |
| Active Idle | 0 | 0 | |
| Target Load | Actual Load | ssj_ops | |
|---|---|---|---|
| Target | Actual | ||
| Calibration 1 | 1,448,131 | ||
| Calibration 2 | 1,445,985 | ||
| Calibration 3 | 1,444,859 | ||
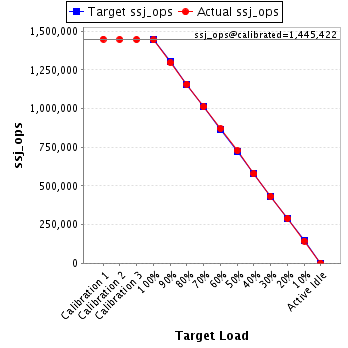
| ssj_ops@calibrated=1,445,422 | |||
| 100% | 99.8% | 1,445,422 | 1,443,022 |
| 90% | 89.7% | 1,300,880 | 1,296,678 |
| 80% | 80.1% | 1,156,338 | 1,157,197 |
| 70% | 70.0% | 1,011,796 | 1,011,660 |
| 60% | 60.2% | 867,253 | 869,925 |
| 50% | 50.3% | 722,711 | 726,799 |
| 40% | 39.9% | 578,169 | 577,253 |
| 30% | 30.0% | 433,627 | 433,186 |
| 20% | 20.0% | 289,084 | 289,362 |
| 10% | 9.9% | 144,542 | 143,551 |
| Active Idle | 0 | 0 | |
| Target Load | Actual Load | ssj_ops | |
|---|---|---|---|
| Target | Actual | ||
| Calibration 1 | 1,435,409 | ||
| Calibration 2 | 1,438,104 | ||
| Calibration 3 | 1,439,106 | ||
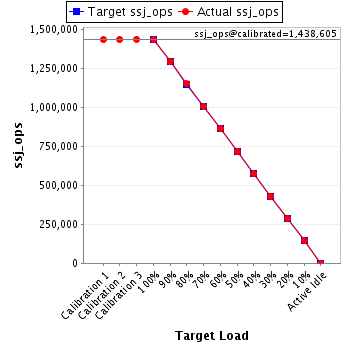
| ssj_ops@calibrated=1,438,605 | |||
| 100% | 99.8% | 1,438,605 | 1,436,444 |
| 90% | 90.1% | 1,294,745 | 1,295,951 |
| 80% | 80.1% | 1,150,884 | 1,151,770 |
| 70% | 70.0% | 1,007,024 | 1,007,277 |
| 60% | 60.1% | 863,163 | 864,052 |
| 50% | 49.9% | 719,303 | 717,802 |
| 40% | 39.9% | 575,442 | 573,854 |
| 30% | 29.9% | 431,582 | 430,184 |
| 20% | 20.0% | 287,721 | 287,718 |
| 10% | 10.0% | 143,861 | 143,583 |
| Active Idle | 0 | 0 | |
| Target Load | Actual Load | ssj_ops | |
|---|---|---|---|
| Target | Actual | ||
| Calibration 1 | 1,444,980 | ||
| Calibration 2 | 1,445,041 | ||
| Calibration 3 | 1,445,754 | ||
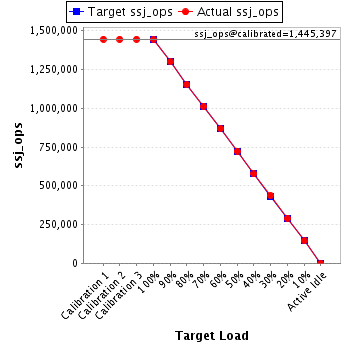
| ssj_ops@calibrated=1,445,397 | |||
| 100% | 99.9% | 1,445,397 | 1,444,076 |
| 90% | 89.9% | 1,300,857 | 1,299,574 |
| 80% | 79.7% | 1,156,318 | 1,152,619 |
| 70% | 70.0% | 1,011,778 | 1,012,191 |
| 60% | 60.0% | 867,238 | 867,822 |
| 50% | 50.0% | 722,699 | 722,976 |
| 40% | 39.9% | 578,159 | 576,041 |
| 30% | 30.2% | 433,619 | 435,796 |
| 20% | 20.0% | 289,079 | 289,681 |
| 10% | 10.0% | 144,540 | 144,785 |
| Active Idle | 0 | 0 | |