
SPECpower_ssj2008
Host 'NODE06' Performance Report
Copyright © 2007-2019 Standard Performance Evaluation Corporation
| Hewlett Packard Enterprise Synergy 480 Gen10 Compute Module | ssj_ops@100% = 5,707,208 ssj_ops@100% per JVM = 1,426,802 |
||||
| Test Sponsor: | Hewlett Packard Enterprise | SPEC License #: | 3 | Test Method: | Multi Node |
| Tested By: | Hewlett Packard Enterprise | Test Location: | Houston, TX, USA | Test Date: | Mar 26, 2019 |
| Hardware Availability: | Apr-2019 | Software Availability: | Mar-2019 | Publication: | May 8, 2019 |
| System Source: | Single Supplier | System Designation: | Server | Power Provisioning: | Line-powered |
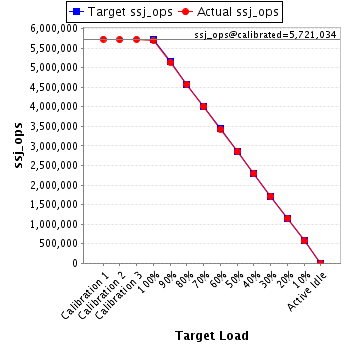
| Target Load | Actual Load | ssj_ops | |
|---|---|---|---|
| Target | Actual | ||
| Calibration 1 | 5,728,621 | ||
| Calibration 2 | 5,718,095 | ||
| Calibration 3 | 5,723,974 | ||
| ssj_ops@calibrated=5,721,034 | |||
| 100% | 99.8% | 5,721,034 | 5,707,208 |
| 90% | 89.8% | 5,148,931 | 5,139,979 |
| 80% | 80.0% | 4,576,828 | 4,574,029 |
| 70% | 70.1% | 4,004,724 | 4,008,923 |
| 60% | 60.0% | 3,432,621 | 3,430,604 |
| 50% | 50.0% | 2,860,517 | 2,861,316 |
| 40% | 40.0% | 2,288,414 | 2,291,157 |
| 30% | 30.0% | 1,716,310 | 1,715,184 |
| 20% | 20.0% | 1,144,207 | 1,146,127 |
| 10% | 10.0% | 572,103 | 572,061 |
| Active Idle | 0 | 0 | |
| Set Identifier: | SUT |
| Set Description: | System Under Test |
| # of Identical Nodes: | 6 |
| Comment: | SUT |
| Hardware | |
|---|---|
| Hardware Vendor: | Hewlett Packard Enterprise |
| Model: | Synergy 480 Gen10 Compute Module |
| Form Factor: | 7U |
| CPU Name: | Intel Xeon Platinum 8280 @ 2.70GHz (Intel Turbo Boost Technology up to 4.00 GHz) |
| CPU Characteristics: | 28-Core, 2.70 GHz, 38.5MB L3 Cache |
| CPU Frequency (MHz): | 2700 |
| CPU(s) Enabled: | 56 cores, 2 chips, 28 cores/chip |
| Hardware Threads: | 112 (2 / core) |
| CPU(s) Orderable: | 1,2 chips |
| Primary Cache: | 32 KB I + 32 KB D on chip per core |
| Secondary Cache: | 1 MB I+D on chip per core |
| Tertiary Cache: | 39424 KB I+D on chip per chip |
| Other Cache: | None |
| Memory Amount (GB): | 192 |
| # and size of DIMM: | 12 x 16384 MB |
| Memory Details: | 12 x 16GB 2Rx8 PC4-2933Y-R; slots 1, 3, 5, 8, 10 and 12 populated in each socket |
| Power Supply Quantity and Rating (W): | None |
| Power Supply Details: | N/A |
| Disk Drive: | 1 x HPE 240GB 6G SATA M.2 SSD (875488-B21) |
| Disk Controller: | HPE Smart Array S100i SR Gen10 |
| # and type of Network Interface Cards (NICs) Installed: | 1 x HPE Synergy 3820C 10/20Gb CNA |
| NICs Enabled in Firmware / OS / Connected: | 2/2/1 |
| Network Speed (Mbit): | 1000 |
| Keyboard: | None |
| Mouse: | None |
| Monitor: | None |
| Optical Drives: | No |
| Other Hardware: | H/S: Standard |
| Software | |
|---|---|
| Power Management: | Enabled (see SUT Notes) |
| Operating System (OS): | Windows Server 2012 R2 Datacenter |
| OS Version: | Version 6.3 (Build 9600) |
| Filesystem: | NTFS |
| JVM Vendor: | Oracle Corporation |
| JVM Version: | Oracle Java HotSpot(TM) 64-Bit Server VM (build 24.80-b11, mixed mode), version 1.7.0_80 |
| JVM Command-line Options: | -server -Xmn21000m -Xms24000m -Xmx24000m -XX:SurvivorRatio=1 -XX:TargetSurvivorRatio=99 -XX:AllocatePrefetchDistance=256 -XX:AllocatePrefetchLines=4 -XX:LoopUnrollLimit=45 -XX:InitialTenuringThreshold=12 -XX:MaxTenuringThreshold=15 -XX:ParallelGCThreads=28 -XX:InlineSmallCode=3900 -XX:MaxInlineSize=270 -XX:FreqInlineSize=2500 -XX:+AggressiveOpts -XX:+UseLargePages -XX:+UseParallelOldGC |
| JVM Affinity: | start /NODE [0,1,2,3] /AFFINITY [0xFFFFFFF] |
| JVM Instances: | 4 |
| JVM Initial Heap (MB): | 24000 |
| JVM Maximum Heap (MB): | 24000 |
| JVM Address Bits: | 64 |
| Boot Firmware Version: | I42 v2.00 (02/02/2019) |
| Management Firmware Version: | 1.40 Feb 05 2019 |
| Workload Version: | SSJ 1.2.10 |
| Director Location: | Controller |
| Other Software: | HPE Service Pack for ProLiant (SPP) Version: 2019.03.0, Microsoft Windows KB4056898, KB4338815 |
| JVM Instance | ssj_ops@100% |
|---|---|
| NODE06.001 | 1,438,341 |
| NODE06.002 | 1,423,425 |
| NODE06.003 | 1,431,504 |
| NODE06.004 | 1,413,938 |
| ssj_ops@100% | 5,707,208 |
| ssj_ops@100% per JVM | 1,426,802 |

| Target Load | Actual Load | ssj_ops | |
|---|---|---|---|
| Target | Actual | ||
| Calibration 1 | 1,445,037 | ||
| Calibration 2 | 1,442,655 | ||
| Calibration 3 | 1,440,790 | ||
| ssj_ops@calibrated=1,441,722 | |||
| 100% | 99.8% | 1,441,722 | 1,438,341 |
| 90% | 89.8% | 1,297,550 | 1,294,557 |
| 80% | 80.0% | 1,153,378 | 1,152,673 |
| 70% | 69.8% | 1,009,206 | 1,006,969 |
| 60% | 60.0% | 865,033 | 864,934 |
| 50% | 50.2% | 720,861 | 724,078 |
| 40% | 40.0% | 576,689 | 576,056 |
| 30% | 29.9% | 432,517 | 430,728 |
| 20% | 20.0% | 288,344 | 287,948 |
| 10% | 10.0% | 144,172 | 143,638 |
| Active Idle | 0 | 0 | |

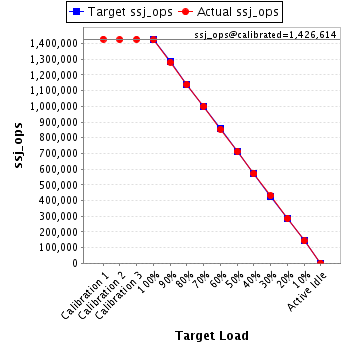
| Target Load | Actual Load | ssj_ops | |
|---|---|---|---|
| Target | Actual | ||
| Calibration 1 | 1,428,380 | ||
| Calibration 2 | 1,425,527 | ||
| Calibration 3 | 1,427,701 | ||
| ssj_ops@calibrated=1,426,614 | |||
| 100% | 99.8% | 1,426,614 | 1,423,425 |
| 90% | 89.8% | 1,283,953 | 1,281,043 |
| 80% | 79.8% | 1,141,291 | 1,138,916 |
| 70% | 70.2% | 998,630 | 1,001,131 |
| 60% | 59.9% | 855,968 | 854,763 |
| 50% | 49.9% | 713,307 | 712,029 |
| 40% | 40.0% | 570,646 | 570,232 |
| 30% | 30.2% | 427,984 | 430,587 |
| 20% | 20.0% | 285,323 | 285,685 |
| 10% | 10.0% | 142,661 | 142,867 |
| Active Idle | 0 | 0 | |
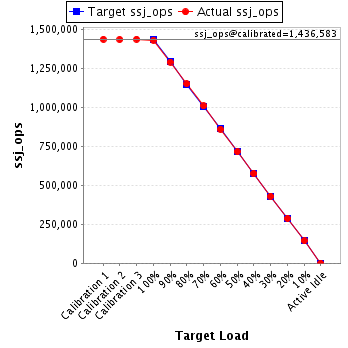
| Target Load | Actual Load | ssj_ops | |
|---|---|---|---|
| Target | Actual | ||
| Calibration 1 | 1,436,662 | ||
| Calibration 2 | 1,435,579 | ||
| Calibration 3 | 1,437,587 | ||
| ssj_ops@calibrated=1,436,583 | |||
| 100% | 99.6% | 1,436,583 | 1,431,504 |
| 90% | 89.9% | 1,292,925 | 1,291,073 |
| 80% | 80.2% | 1,149,266 | 1,151,453 |
| 70% | 70.3% | 1,005,608 | 1,009,231 |
| 60% | 59.9% | 861,950 | 860,598 |
| 50% | 49.8% | 718,291 | 715,687 |
| 40% | 40.0% | 574,633 | 575,332 |
| 30% | 30.0% | 430,975 | 430,838 |
| 20% | 20.0% | 287,317 | 287,512 |
| 10% | 10.0% | 143,658 | 144,359 |
| Active Idle | 0 | 0 | |
| Target Load | Actual Load | ssj_ops | |
|---|---|---|---|
| Target | Actual | ||
| Calibration 1 | 1,418,542 | ||
| Calibration 2 | 1,414,334 | ||
| Calibration 3 | 1,417,896 | ||
| ssj_ops@calibrated=1,416,115 | |||
| 100% | 99.8% | 1,416,115 | 1,413,938 |
| 90% | 89.9% | 1,274,504 | 1,273,306 |
| 80% | 79.9% | 1,132,892 | 1,130,988 |
| 70% | 70.0% | 991,281 | 991,592 |
| 60% | 60.0% | 849,669 | 850,309 |
| 50% | 50.1% | 708,058 | 709,521 |
| 40% | 40.2% | 566,446 | 569,537 |
| 30% | 29.9% | 424,835 | 423,031 |
| 20% | 20.1% | 283,223 | 284,983 |
| 10% | 10.0% | 141,612 | 141,197 |
| Active Idle | 0 | 0 | |
