SPECpower_ssj2008
Host 'NODE03' Performance Report
Copyright © 2007-2019 Standard Performance Evaluation Corporation
| Hewlett Packard Enterprise Synergy 480 Gen10 Compute Module | ssj_ops@100% = 5,759,851 ssj_ops@100% per JVM = 1,439,963 |
||||
| Test Sponsor: | Hewlett Packard Enterprise | SPEC License #: | 3 | Test Method: | Multi Node |
| Tested By: | Hewlett Packard Enterprise | Test Location: | Houston, TX, USA | Test Date: | Apr 8, 2019 |
| Hardware Availability: | Apr-2019 | Software Availability: | Mar-2019 | Publication: | May 8, 2019 |
| System Source: | Single Supplier | System Designation: | Server | Power Provisioning: | Line-powered |
| Target Load | Actual Load | ssj_ops | |
|---|---|---|---|
| Target | Actual | ||
| Calibration 1 | 5,777,862 | ||
| Calibration 2 | 5,778,397 | ||
| Calibration 3 | 5,784,388 | ||
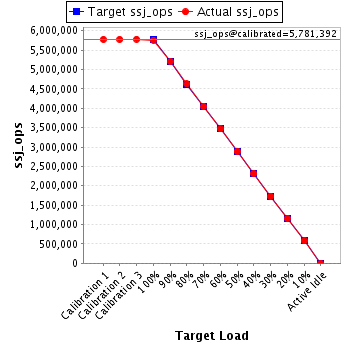
| ssj_ops@calibrated=5,781,392 | |||
| 100% | 99.6% | 5,781,392 | 5,759,851 |
| 90% | 90.1% | 5,203,253 | 5,208,026 |
| 80% | 80.0% | 4,625,114 | 4,627,710 |
| 70% | 70.0% | 4,046,975 | 4,046,598 |
| 60% | 59.9% | 3,468,835 | 3,465,741 |
| 50% | 50.0% | 2,890,696 | 2,891,651 |
| 40% | 40.0% | 2,312,557 | 2,314,244 |
| 30% | 30.0% | 1,734,418 | 1,733,945 |
| 20% | 20.0% | 1,156,278 | 1,156,777 |
| 10% | 10.0% | 578,139 | 577,972 |
| Active Idle | 0 | 0 | |
| Set Identifier: | SUT |
| Set Description: | System Under Test |
| # of Identical Nodes: | 12 |
| Comment: | SUT |
| Hardware | |
|---|---|
| Hardware Vendor: | Hewlett Packard Enterprise |
| Model: | Synergy 480 Gen10 Compute Module |
| Form Factor: | 7U |
| CPU Name: | Intel Xeon Platinum 8280 @ 2.70GHz (Intel Turbo Boost Technology up to 4.00 GHz) |
| CPU Characteristics: | 28-Core, 2.70 GHz, 38.5MB L3 Cache |
| CPU Frequency (MHz): | 2700 |
| CPU(s) Enabled: | 56 cores, 2 chips, 28 cores/chip |
| Hardware Threads: | 112 (2 / core) |
| CPU(s) Orderable: | 1,2 chips |
| Primary Cache: | 32 KB I + 32 KB D on chip per core |
| Secondary Cache: | 1 MB I+D on chip per core |
| Tertiary Cache: | 39424 KB I+D on chip per chip |
| Other Cache: | None |
| Memory Amount (GB): | 192 |
| # and size of DIMM: | 12 x 16384 MB |
| Memory Details: | 12 x 16GB 2Rx8 PC4-2933Y-R; slots 1, 3, 5, 8, 10 and 12 populated in each socket |
| Power Supply Quantity and Rating (W): | None |
| Power Supply Details: | N/A |
| Disk Drive: | 1 x HPE 240GB 6G SATA M.2 SSD (875488-B21) |
| Disk Controller: | HPE Smart Array S100i SR Gen10 |
| # and type of Network Interface Cards (NICs) Installed: | 1 x HPE Synergy 3820C 10/20Gb CNA |
| NICs Enabled in Firmware / OS / Connected: | 2/2/1 |
| Network Speed (Mbit): | 1000 |
| Keyboard: | None |
| Mouse: | None |
| Monitor: | None |
| Optical Drives: | No |
| Other Hardware: | H/S: Standard |
| Software | |
|---|---|
| Power Management: | Enabled (see SUT Notes) |
| Operating System (OS): | Windows Server 2012 R2 Datacenter |
| OS Version: | Version 6.3 (Build 9600) |
| Filesystem: | NTFS |
| JVM Vendor: | Oracle Corporation |
| JVM Version: | Oracle Java HotSpot(TM) 64-Bit Server VM (build 24.80-b11, mixed mode), version 1.7.0_80 |
| JVM Command-line Options: | -server -Xmn19000m -Xms21000m -Xmx21000m -XX:SurvivorRatio=1 -XX:TargetSurvivorRatio=99 -XX:AllocatePrefetchDistance=256 -XX:AllocatePrefetchLines=4 -XX:LoopUnrollLimit=45 -XX:InitialTenuringThreshold=12 -XX:MaxTenuringThreshold=15 -XX:ParallelGCThreads=28 -XX:InlineSmallCode=3900 -XX:MaxInlineSize=270 -XX:FreqInlineSize=2500 -XX:+AggressiveOpts -XX:+UseLargePages -XX:+UseParallelOldGC |
| JVM Affinity: | start /NODE [0,1,2,3] /AFFINITY [0xFFFFFFF] |
| JVM Instances: | 4 |
| JVM Initial Heap (MB): | 21000 |
| JVM Maximum Heap (MB): | 21000 |
| JVM Address Bits: | 64 |
| Boot Firmware Version: | I42 v2.00 (02/02/2019) |
| Management Firmware Version: | 1.40 Feb 05 2019 |
| Workload Version: | SSJ 1.2.10 |
| Director Location: | Controller |
| Other Software: | HPE Service Pack for ProLiant (SPP) Version: 2019.03.0, Microsoft Windows KB4056898, KB4338815 |
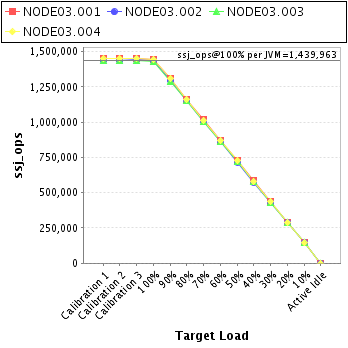
| JVM Instance | ssj_ops@100% |
|---|---|
| NODE03.001 | 1,445,906 |
| NODE03.002 | 1,435,661 |
| NODE03.003 | 1,432,696 |
| NODE03.004 | 1,445,589 |
| ssj_ops@100% | 5,759,851 |
| ssj_ops@100% per JVM | 1,439,963 |
| Target Load | Actual Load | ssj_ops | |
|---|---|---|---|
| Target | Actual | ||
| Calibration 1 | 1,452,410 | ||
| Calibration 2 | 1,452,434 | ||
| Calibration 3 | 1,452,936 | ||
| ssj_ops@calibrated=1,452,685 | |||
| 100% | 99.5% | 1,452,685 | 1,445,906 |
| 90% | 90.2% | 1,307,416 | 1,310,023 |
| 80% | 80.1% | 1,162,148 | 1,163,884 |
| 70% | 70.2% | 1,016,879 | 1,019,123 |
| 60% | 59.9% | 871,611 | 870,308 |
| 50% | 50.1% | 726,342 | 727,763 |
| 40% | 40.2% | 581,074 | 583,295 |
| 30% | 30.0% | 435,805 | 435,133 |
| 20% | 20.1% | 290,537 | 292,472 |
| 10% | 9.9% | 145,268 | 144,438 |
| Active Idle | 0 | 0 | |

| Target Load | Actual Load | ssj_ops | |
|---|---|---|---|
| Target | Actual | ||
| Calibration 1 | 1,438,357 | ||
| Calibration 2 | 1,436,464 | ||
| Calibration 3 | 1,442,023 | ||
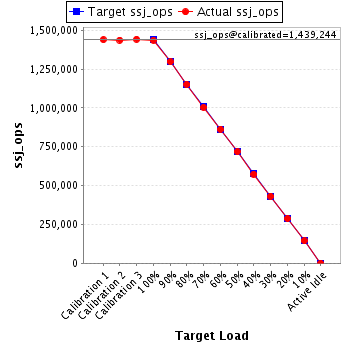
| ssj_ops@calibrated=1,439,244 | |||
| 100% | 99.8% | 1,439,244 | 1,435,661 |
| 90% | 90.1% | 1,295,319 | 1,297,010 |
| 80% | 80.0% | 1,151,395 | 1,150,971 |
| 70% | 69.8% | 1,007,471 | 1,004,032 |
| 60% | 60.0% | 863,546 | 863,481 |
| 50% | 49.9% | 719,622 | 717,870 |
| 40% | 39.8% | 575,697 | 573,378 |
| 30% | 30.0% | 431,773 | 431,750 |
| 20% | 19.9% | 287,849 | 286,836 |
| 10% | 10.0% | 143,924 | 144,540 |
| Active Idle | 0 | 0 | |
| Target Load | Actual Load | ssj_ops | |
|---|---|---|---|
| Target | Actual | ||
| Calibration 1 | 1,436,739 | ||
| Calibration 2 | 1,436,998 | ||
| Calibration 3 | 1,435,471 | ||
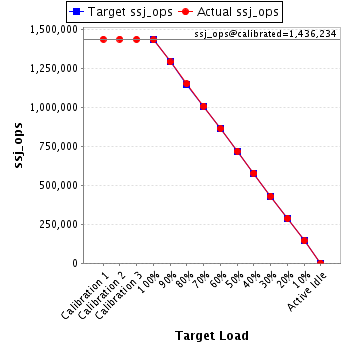
| ssj_ops@calibrated=1,436,234 | |||
| 100% | 99.8% | 1,436,234 | 1,432,696 |
| 90% | 89.9% | 1,292,611 | 1,290,905 |
| 80% | 80.1% | 1,148,987 | 1,150,971 |
| 70% | 70.2% | 1,005,364 | 1,008,149 |
| 60% | 60.1% | 861,741 | 863,093 |
| 50% | 50.0% | 718,117 | 718,423 |
| 40% | 40.2% | 574,494 | 577,203 |
| 30% | 30.0% | 430,870 | 430,474 |
| 20% | 20.0% | 287,247 | 287,468 |
| 10% | 10.1% | 143,623 | 144,673 |
| Active Idle | 0 | 0 | |
| Target Load | Actual Load | ssj_ops | |
|---|---|---|---|
| Target | Actual | ||
| Calibration 1 | 1,450,355 | ||
| Calibration 2 | 1,452,501 | ||
| Calibration 3 | 1,453,958 | ||
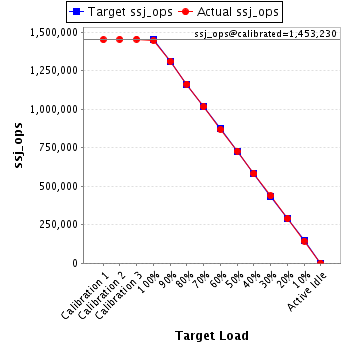
| ssj_ops@calibrated=1,453,230 | |||
| 100% | 99.5% | 1,453,230 | 1,445,589 |
| 90% | 90.2% | 1,307,907 | 1,310,088 |
| 80% | 80.0% | 1,162,584 | 1,161,884 |
| 70% | 69.9% | 1,017,261 | 1,015,294 |
| 60% | 59.8% | 871,938 | 868,859 |
| 50% | 50.1% | 726,615 | 727,596 |
| 40% | 39.9% | 581,292 | 580,368 |
| 30% | 30.0% | 435,969 | 436,589 |
| 20% | 20.0% | 290,646 | 290,001 |
| 10% | 9.9% | 145,323 | 144,321 |
| Active Idle | 0 | 0 | |