SPECpower_ssj2008
Host 'NODE04' Performance Report
Copyright © 2007-2019 Standard Performance Evaluation Corporation
| Hewlett Packard Enterprise Synergy 480 Gen10 Compute Module | ssj_ops@100% = 5,783,375 ssj_ops@100% per JVM = 1,445,844 |
||||
| Test Sponsor: | Hewlett Packard Enterprise | SPEC License #: | 3 | Test Method: | Multi Node |
| Tested By: | Hewlett Packard Enterprise | Test Location: | Houston, TX, USA | Test Date: | Apr 8, 2019 |
| Hardware Availability: | Apr-2019 | Software Availability: | Mar-2019 | Publication: | May 8, 2019 |
| System Source: | Single Supplier | System Designation: | Server | Power Provisioning: | Line-powered |
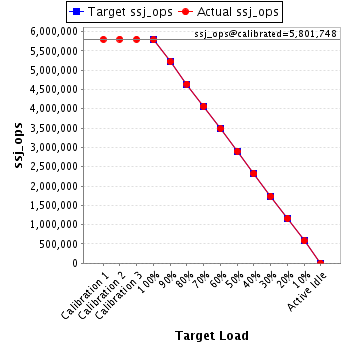
| Target Load | Actual Load | ssj_ops | |
|---|---|---|---|
| Target | Actual | ||
| Calibration 1 | 5,798,736 | ||
| Calibration 2 | 5,802,764 | ||
| Calibration 3 | 5,800,733 | ||
| ssj_ops@calibrated=5,801,748 | |||
| 100% | 99.7% | 5,801,748 | 5,783,375 |
| 90% | 90.0% | 5,221,574 | 5,221,928 |
| 80% | 80.0% | 4,641,399 | 4,640,563 |
| 70% | 70.2% | 4,061,224 | 4,070,148 |
| 60% | 60.0% | 3,481,049 | 3,481,692 |
| 50% | 50.0% | 2,900,874 | 2,901,003 |
| 40% | 39.9% | 2,320,699 | 2,316,724 |
| 30% | 30.0% | 1,740,525 | 1,738,087 |
| 20% | 20.0% | 1,160,350 | 1,162,938 |
| 10% | 10.0% | 580,175 | 580,527 |
| Active Idle | 0 | 0 | |
| Set Identifier: | SUT |
| Set Description: | System Under Test |
| # of Identical Nodes: | 12 |
| Comment: | SUT |
| Hardware | |
|---|---|
| Hardware Vendor: | Hewlett Packard Enterprise |
| Model: | Synergy 480 Gen10 Compute Module |
| Form Factor: | 7U |
| CPU Name: | Intel Xeon Platinum 8280 @ 2.70GHz (Intel Turbo Boost Technology up to 4.00 GHz) |
| CPU Characteristics: | 28-Core, 2.70 GHz, 38.5MB L3 Cache |
| CPU Frequency (MHz): | 2700 |
| CPU(s) Enabled: | 56 cores, 2 chips, 28 cores/chip |
| Hardware Threads: | 112 (2 / core) |
| CPU(s) Orderable: | 1,2 chips |
| Primary Cache: | 32 KB I + 32 KB D on chip per core |
| Secondary Cache: | 1 MB I+D on chip per core |
| Tertiary Cache: | 39424 KB I+D on chip per chip |
| Other Cache: | None |
| Memory Amount (GB): | 192 |
| # and size of DIMM: | 12 x 16384 MB |
| Memory Details: | 12 x 16GB 2Rx8 PC4-2933Y-R; slots 1, 3, 5, 8, 10 and 12 populated in each socket |
| Power Supply Quantity and Rating (W): | None |
| Power Supply Details: | N/A |
| Disk Drive: | 1 x HPE 240GB 6G SATA M.2 SSD (875488-B21) |
| Disk Controller: | HPE Smart Array S100i SR Gen10 |
| # and type of Network Interface Cards (NICs) Installed: | 1 x HPE Synergy 3820C 10/20Gb CNA |
| NICs Enabled in Firmware / OS / Connected: | 2/2/1 |
| Network Speed (Mbit): | 1000 |
| Keyboard: | None |
| Mouse: | None |
| Monitor: | None |
| Optical Drives: | No |
| Other Hardware: | H/S: Standard |
| Software | |
|---|---|
| Power Management: | Enabled (see SUT Notes) |
| Operating System (OS): | Windows Server 2012 R2 Datacenter |
| OS Version: | Version 6.3 (Build 9600) |
| Filesystem: | NTFS |
| JVM Vendor: | Oracle Corporation |
| JVM Version: | Oracle Java HotSpot(TM) 64-Bit Server VM (build 24.80-b11, mixed mode), version 1.7.0_80 |
| JVM Command-line Options: | -server -Xmn19000m -Xms21000m -Xmx21000m -XX:SurvivorRatio=1 -XX:TargetSurvivorRatio=99 -XX:AllocatePrefetchDistance=256 -XX:AllocatePrefetchLines=4 -XX:LoopUnrollLimit=45 -XX:InitialTenuringThreshold=12 -XX:MaxTenuringThreshold=15 -XX:ParallelGCThreads=28 -XX:InlineSmallCode=3900 -XX:MaxInlineSize=270 -XX:FreqInlineSize=2500 -XX:+AggressiveOpts -XX:+UseLargePages -XX:+UseParallelOldGC |
| JVM Affinity: | start /NODE [0,1,2,3] /AFFINITY [0xFFFFFFF] |
| JVM Instances: | 4 |
| JVM Initial Heap (MB): | 21000 |
| JVM Maximum Heap (MB): | 21000 |
| JVM Address Bits: | 64 |
| Boot Firmware Version: | I42 v2.00 (02/02/2019) |
| Management Firmware Version: | 1.40 Feb 05 2019 |
| Workload Version: | SSJ 1.2.10 |
| Director Location: | Controller |
| Other Software: | HPE Service Pack for ProLiant (SPP) Version: 2019.03.0, Microsoft Windows KB4056898, KB4338815 |
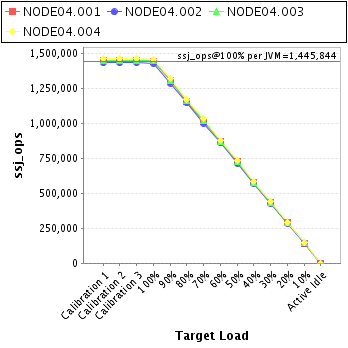
| JVM Instance | ssj_ops@100% |
|---|---|
| NODE04.001 | 1,446,639 |
| NODE04.002 | 1,429,835 |
| NODE04.003 | 1,446,890 |
| NODE04.004 | 1,460,011 |
| ssj_ops@100% | 5,783,375 |
| ssj_ops@100% per JVM | 1,445,844 |
| Target Load | Actual Load | ssj_ops | |
|---|---|---|---|
| Target | Actual | ||
| Calibration 1 | 1,451,958 | ||
| Calibration 2 | 1,448,925 | ||
| Calibration 3 | 1,448,575 | ||
| ssj_ops@calibrated=1,448,750 | |||
| 100% | 99.9% | 1,448,750 | 1,446,639 |
| 90% | 90.0% | 1,303,875 | 1,303,792 |
| 80% | 80.1% | 1,159,000 | 1,159,920 |
| 70% | 70.0% | 1,014,125 | 1,014,048 |
| 60% | 60.0% | 869,250 | 869,905 |
| 50% | 50.1% | 724,375 | 726,196 |
| 40% | 39.9% | 579,500 | 578,769 |
| 30% | 29.9% | 434,625 | 432,929 |
| 20% | 20.1% | 289,750 | 291,005 |
| 10% | 10.0% | 144,875 | 144,717 |
| Active Idle | 0 | 0 | |

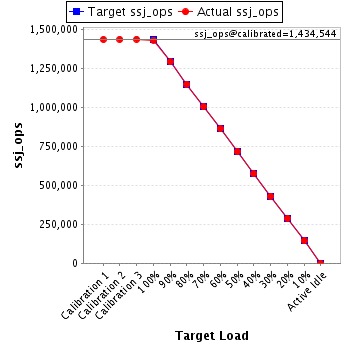
| Target Load | Actual Load | ssj_ops | |
|---|---|---|---|
| Target | Actual | ||
| Calibration 1 | 1,432,983 | ||
| Calibration 2 | 1,433,714 | ||
| Calibration 3 | 1,435,374 | ||
| ssj_ops@calibrated=1,434,544 | |||
| 100% | 99.7% | 1,434,544 | 1,429,835 |
| 90% | 89.9% | 1,291,089 | 1,289,144 |
| 80% | 80.0% | 1,147,635 | 1,147,432 |
| 70% | 69.8% | 1,004,181 | 1,001,645 |
| 60% | 60.0% | 860,726 | 861,190 |
| 50% | 49.9% | 717,272 | 715,974 |
| 40% | 40.0% | 573,818 | 573,231 |
| 30% | 30.0% | 430,363 | 429,988 |
| 20% | 20.1% | 286,909 | 287,852 |
| 10% | 10.0% | 143,454 | 143,073 |
| Active Idle | 0 | 0 | |
| Target Load | Actual Load | ssj_ops | |
|---|---|---|---|
| Target | Actual | ||
| Calibration 1 | 1,449,229 | ||
| Calibration 2 | 1,453,438 | ||
| Calibration 3 | 1,449,903 | ||
| ssj_ops@calibrated=1,451,671 | |||
| 100% | 99.7% | 1,451,671 | 1,446,890 |
| 90% | 90.0% | 1,306,504 | 1,306,881 |
| 80% | 80.0% | 1,161,337 | 1,161,728 |
| 70% | 70.2% | 1,016,169 | 1,019,357 |
| 60% | 59.9% | 871,002 | 870,081 |
| 50% | 49.9% | 725,835 | 724,386 |
| 40% | 40.0% | 580,668 | 580,393 |
| 30% | 30.0% | 435,501 | 435,593 |
| 20% | 20.1% | 290,334 | 291,512 |
| 10% | 10.1% | 145,167 | 145,917 |
| Active Idle | 0 | 0 | |

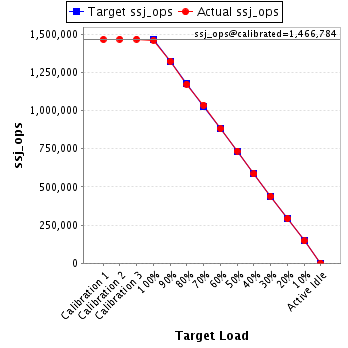
| Target Load | Actual Load | ssj_ops | |
|---|---|---|---|
| Target | Actual | ||
| Calibration 1 | 1,464,566 | ||
| Calibration 2 | 1,466,687 | ||
| Calibration 3 | 1,466,880 | ||
| ssj_ops@calibrated=1,466,784 | |||
| 100% | 99.5% | 1,466,784 | 1,460,011 |
| 90% | 90.1% | 1,320,105 | 1,322,111 |
| 80% | 79.9% | 1,173,427 | 1,171,482 |
| 70% | 70.6% | 1,026,748 | 1,035,098 |
| 60% | 60.0% | 880,070 | 880,516 |
| 50% | 50.1% | 733,392 | 734,447 |
| 40% | 39.8% | 586,713 | 584,331 |
| 30% | 30.0% | 440,035 | 439,577 |
| 20% | 19.9% | 293,357 | 292,569 |
| 10% | 10.0% | 146,678 | 146,821 |
| Active Idle | 0 | 0 | |