SPECpower_ssj2008
Host 'NODE07' Performance Report
Copyright © 2007-2019 Standard Performance Evaluation Corporation
| Hewlett Packard Enterprise Synergy 480 Gen10 Compute Module | ssj_ops@100% = 5,752,351 ssj_ops@100% per JVM = 1,438,088 |
||||
| Test Sponsor: | Hewlett Packard Enterprise | SPEC License #: | 3 | Test Method: | Multi Node |
| Tested By: | Hewlett Packard Enterprise | Test Location: | Houston, TX, USA | Test Date: | Apr 8, 2019 |
| Hardware Availability: | Apr-2019 | Software Availability: | Mar-2019 | Publication: | May 8, 2019 |
| System Source: | Single Supplier | System Designation: | Server | Power Provisioning: | Line-powered |
| Target Load | Actual Load | ssj_ops | |
|---|---|---|---|
| Target | Actual | ||
| Calibration 1 | 5,775,216 | ||
| Calibration 2 | 5,772,257 | ||
| Calibration 3 | 5,774,560 | ||
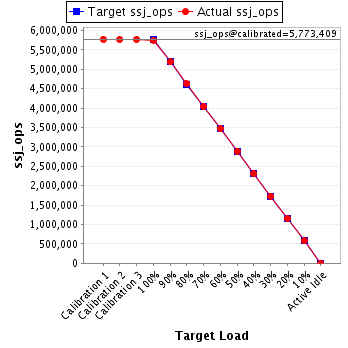
| ssj_ops@calibrated=5,773,409 | |||
| 100% | 99.6% | 5,773,409 | 5,752,351 |
| 90% | 89.9% | 5,196,068 | 5,187,871 |
| 80% | 80.0% | 4,618,727 | 4,621,446 |
| 70% | 69.9% | 4,041,386 | 4,034,772 |
| 60% | 60.1% | 3,464,045 | 3,470,092 |
| 50% | 50.0% | 2,886,704 | 2,889,484 |
| 40% | 39.9% | 2,309,363 | 2,303,551 |
| 30% | 30.0% | 1,732,023 | 1,733,120 |
| 20% | 20.0% | 1,154,682 | 1,157,108 |
| 10% | 10.0% | 577,341 | 576,162 |
| Active Idle | 0 | 0 | |
| Set Identifier: | SUT |
| Set Description: | System Under Test |
| # of Identical Nodes: | 12 |
| Comment: | SUT |
| Hardware | |
|---|---|
| Hardware Vendor: | Hewlett Packard Enterprise |
| Model: | Synergy 480 Gen10 Compute Module |
| Form Factor: | 7U |
| CPU Name: | Intel Xeon Platinum 8280 @ 2.70GHz (Intel Turbo Boost Technology up to 4.00 GHz) |
| CPU Characteristics: | 28-Core, 2.70 GHz, 38.5MB L3 Cache |
| CPU Frequency (MHz): | 2700 |
| CPU(s) Enabled: | 56 cores, 2 chips, 28 cores/chip |
| Hardware Threads: | 112 (2 / core) |
| CPU(s) Orderable: | 1,2 chips |
| Primary Cache: | 32 KB I + 32 KB D on chip per core |
| Secondary Cache: | 1 MB I+D on chip per core |
| Tertiary Cache: | 39424 KB I+D on chip per chip |
| Other Cache: | None |
| Memory Amount (GB): | 192 |
| # and size of DIMM: | 12 x 16384 MB |
| Memory Details: | 12 x 16GB 2Rx8 PC4-2933Y-R; slots 1, 3, 5, 8, 10 and 12 populated in each socket |
| Power Supply Quantity and Rating (W): | None |
| Power Supply Details: | N/A |
| Disk Drive: | 1 x HPE 240GB 6G SATA M.2 SSD (875488-B21) |
| Disk Controller: | HPE Smart Array S100i SR Gen10 |
| # and type of Network Interface Cards (NICs) Installed: | 1 x HPE Synergy 3820C 10/20Gb CNA |
| NICs Enabled in Firmware / OS / Connected: | 2/2/1 |
| Network Speed (Mbit): | 1000 |
| Keyboard: | None |
| Mouse: | None |
| Monitor: | None |
| Optical Drives: | No |
| Other Hardware: | H/S: Standard |
| Software | |
|---|---|
| Power Management: | Enabled (see SUT Notes) |
| Operating System (OS): | Windows Server 2012 R2 Datacenter |
| OS Version: | Version 6.3 (Build 9600) |
| Filesystem: | NTFS |
| JVM Vendor: | Oracle Corporation |
| JVM Version: | Oracle Java HotSpot(TM) 64-Bit Server VM (build 24.80-b11, mixed mode), version 1.7.0_80 |
| JVM Command-line Options: | -server -Xmn19000m -Xms21000m -Xmx21000m -XX:SurvivorRatio=1 -XX:TargetSurvivorRatio=99 -XX:AllocatePrefetchDistance=256 -XX:AllocatePrefetchLines=4 -XX:LoopUnrollLimit=45 -XX:InitialTenuringThreshold=12 -XX:MaxTenuringThreshold=15 -XX:ParallelGCThreads=28 -XX:InlineSmallCode=3900 -XX:MaxInlineSize=270 -XX:FreqInlineSize=2500 -XX:+AggressiveOpts -XX:+UseLargePages -XX:+UseParallelOldGC |
| JVM Affinity: | start /NODE [0,1,2,3] /AFFINITY [0xFFFFFFF] |
| JVM Instances: | 4 |
| JVM Initial Heap (MB): | 21000 |
| JVM Maximum Heap (MB): | 21000 |
| JVM Address Bits: | 64 |
| Boot Firmware Version: | I42 v2.00 (02/02/2019) |
| Management Firmware Version: | 1.40 Feb 05 2019 |
| Workload Version: | SSJ 1.2.10 |
| Director Location: | Controller |
| Other Software: | HPE Service Pack for ProLiant (SPP) Version: 2019.03.0, Microsoft Windows KB4056898, KB4338815 |
| JVM Instance | ssj_ops@100% |
|---|---|
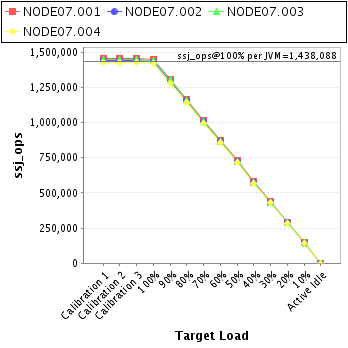
| NODE07.001 | 1,452,061 |
| NODE07.002 | 1,437,864 |
| NODE07.003 | 1,441,118 |
| NODE07.004 | 1,421,308 |
| ssj_ops@100% | 5,752,351 |
| ssj_ops@100% per JVM | 1,438,088 |
| Target Load | Actual Load | ssj_ops | |
|---|---|---|---|
| Target | Actual | ||
| Calibration 1 | 1,456,579 | ||
| Calibration 2 | 1,458,434 | ||
| Calibration 3 | 1,456,124 | ||
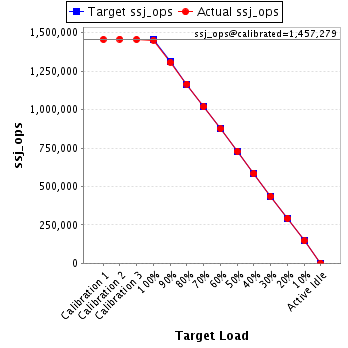
| ssj_ops@calibrated=1,457,279 | |||
| 100% | 99.6% | 1,457,279 | 1,452,061 |
| 90% | 89.7% | 1,311,551 | 1,307,333 |
| 80% | 80.0% | 1,165,823 | 1,166,417 |
| 70% | 69.9% | 1,020,095 | 1,018,763 |
| 60% | 60.0% | 874,367 | 874,219 |
| 50% | 50.0% | 728,640 | 728,376 |
| 40% | 40.0% | 582,912 | 582,670 |
| 30% | 29.9% | 437,184 | 436,338 |
| 20% | 20.1% | 291,456 | 292,866 |
| 10% | 10.0% | 145,728 | 146,339 |
| Active Idle | 0 | 0 | |
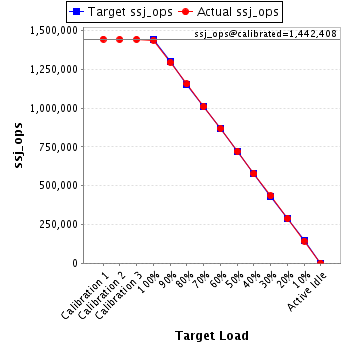
| Target Load | Actual Load | ssj_ops | |
|---|---|---|---|
| Target | Actual | ||
| Calibration 1 | 1,443,873 | ||
| Calibration 2 | 1,441,886 | ||
| Calibration 3 | 1,442,930 | ||
| ssj_ops@calibrated=1,442,408 | |||
| 100% | 99.7% | 1,442,408 | 1,437,864 |
| 90% | 89.7% | 1,298,168 | 1,294,264 |
| 80% | 80.1% | 1,153,927 | 1,155,022 |
| 70% | 70.0% | 1,009,686 | 1,009,370 |
| 60% | 60.2% | 865,445 | 868,425 |
| 50% | 50.0% | 721,204 | 721,143 |
| 40% | 39.9% | 576,963 | 575,916 |
| 30% | 30.1% | 432,723 | 433,761 |
| 20% | 20.0% | 288,482 | 288,469 |
| 10% | 9.9% | 144,241 | 143,303 |
| Active Idle | 0 | 0 | |
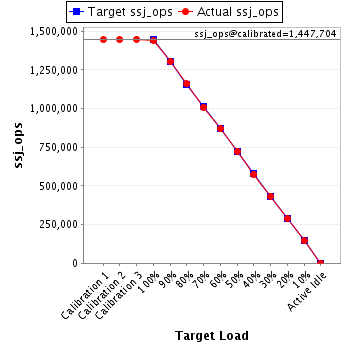
| Target Load | Actual Load | ssj_ops | |
|---|---|---|---|
| Target | Actual | ||
| Calibration 1 | 1,446,069 | ||
| Calibration 2 | 1,446,462 | ||
| Calibration 3 | 1,448,947 | ||
| ssj_ops@calibrated=1,447,704 | |||
| 100% | 99.5% | 1,447,704 | 1,441,118 |
| 90% | 90.1% | 1,302,934 | 1,304,837 |
| 80% | 80.1% | 1,158,163 | 1,160,102 |
| 70% | 69.7% | 1,013,393 | 1,009,392 |
| 60% | 60.0% | 868,622 | 869,237 |
| 50% | 49.9% | 723,852 | 722,849 |
| 40% | 39.8% | 579,082 | 576,104 |
| 30% | 30.0% | 434,311 | 433,850 |
| 20% | 20.0% | 289,541 | 290,032 |
| 10% | 10.0% | 144,770 | 144,608 |
| Active Idle | 0 | 0 | |
| Target Load | Actual Load | ssj_ops | |
|---|---|---|---|
| Target | Actual | ||
| Calibration 1 | 1,428,695 | ||
| Calibration 2 | 1,425,475 | ||
| Calibration 3 | 1,426,559 | ||
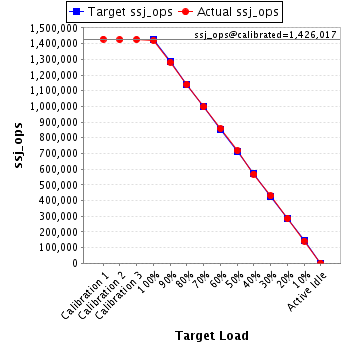
| ssj_ops@calibrated=1,426,017 | |||
| 100% | 99.7% | 1,426,017 | 1,421,308 |
| 90% | 89.9% | 1,283,416 | 1,281,436 |
| 80% | 79.9% | 1,140,814 | 1,139,905 |
| 70% | 69.9% | 998,212 | 997,247 |
| 60% | 60.2% | 855,610 | 858,212 |
| 50% | 50.3% | 713,009 | 717,115 |
| 40% | 39.9% | 570,407 | 568,860 |
| 30% | 30.1% | 427,805 | 429,170 |
| 20% | 20.0% | 285,203 | 285,741 |
| 10% | 10.0% | 142,602 | 141,912 |
| Active Idle | 0 | 0 | |