SPECpower_ssj2008
Host 'NODE08' Performance Report
Copyright © 2007-2019 Standard Performance Evaluation Corporation
| Hewlett Packard Enterprise Synergy 480 Gen10 Compute Module | ssj_ops@100% = 5,748,411 ssj_ops@100% per JVM = 1,437,103 |
||||
| Test Sponsor: | Hewlett Packard Enterprise | SPEC License #: | 3 | Test Method: | Multi Node |
| Tested By: | Hewlett Packard Enterprise | Test Location: | Houston, TX, USA | Test Date: | Apr 8, 2019 |
| Hardware Availability: | Apr-2019 | Software Availability: | Mar-2019 | Publication: | May 8, 2019 |
| System Source: | Single Supplier | System Designation: | Server | Power Provisioning: | Line-powered |
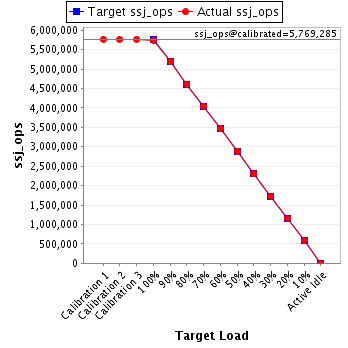
| Target Load | Actual Load | ssj_ops | |
|---|---|---|---|
| Target | Actual | ||
| Calibration 1 | 5,769,158 | ||
| Calibration 2 | 5,766,350 | ||
| Calibration 3 | 5,772,221 | ||
| ssj_ops@calibrated=5,769,285 | |||
| 100% | 99.6% | 5,769,285 | 5,748,411 |
| 90% | 90.0% | 5,192,357 | 5,194,877 |
| 80% | 80.0% | 4,615,428 | 4,614,081 |
| 70% | 70.1% | 4,038,500 | 4,042,004 |
| 60% | 60.0% | 3,461,571 | 3,461,469 |
| 50% | 50.1% | 2,884,643 | 2,888,555 |
| 40% | 39.9% | 2,307,714 | 2,303,731 |
| 30% | 29.9% | 1,730,786 | 1,726,949 |
| 20% | 20.0% | 1,153,857 | 1,155,542 |
| 10% | 10.0% | 576,929 | 578,720 |
| Active Idle | 0 | 0 | |
| Set Identifier: | SUT |
| Set Description: | System Under Test |
| # of Identical Nodes: | 12 |
| Comment: | SUT |
| Hardware | |
|---|---|
| Hardware Vendor: | Hewlett Packard Enterprise |
| Model: | Synergy 480 Gen10 Compute Module |
| Form Factor: | 7U |
| CPU Name: | Intel Xeon Platinum 8280 @ 2.70GHz (Intel Turbo Boost Technology up to 4.00 GHz) |
| CPU Characteristics: | 28-Core, 2.70 GHz, 38.5MB L3 Cache |
| CPU Frequency (MHz): | 2700 |
| CPU(s) Enabled: | 56 cores, 2 chips, 28 cores/chip |
| Hardware Threads: | 112 (2 / core) |
| CPU(s) Orderable: | 1,2 chips |
| Primary Cache: | 32 KB I + 32 KB D on chip per core |
| Secondary Cache: | 1 MB I+D on chip per core |
| Tertiary Cache: | 39424 KB I+D on chip per chip |
| Other Cache: | None |
| Memory Amount (GB): | 192 |
| # and size of DIMM: | 12 x 16384 MB |
| Memory Details: | 12 x 16GB 2Rx8 PC4-2933Y-R; slots 1, 3, 5, 8, 10 and 12 populated in each socket |
| Power Supply Quantity and Rating (W): | None |
| Power Supply Details: | N/A |
| Disk Drive: | 1 x HPE 240GB 6G SATA M.2 SSD (875488-B21) |
| Disk Controller: | HPE Smart Array S100i SR Gen10 |
| # and type of Network Interface Cards (NICs) Installed: | 1 x HPE Synergy 3820C 10/20Gb CNA |
| NICs Enabled in Firmware / OS / Connected: | 2/2/1 |
| Network Speed (Mbit): | 1000 |
| Keyboard: | None |
| Mouse: | None |
| Monitor: | None |
| Optical Drives: | No |
| Other Hardware: | H/S: Standard |
| Software | |
|---|---|
| Power Management: | Enabled (see SUT Notes) |
| Operating System (OS): | Windows Server 2012 R2 Datacenter |
| OS Version: | Version 6.3 (Build 9600) |
| Filesystem: | NTFS |
| JVM Vendor: | Oracle Corporation |
| JVM Version: | Oracle Java HotSpot(TM) 64-Bit Server VM (build 24.80-b11, mixed mode), version 1.7.0_80 |
| JVM Command-line Options: | -server -Xmn19000m -Xms21000m -Xmx21000m -XX:SurvivorRatio=1 -XX:TargetSurvivorRatio=99 -XX:AllocatePrefetchDistance=256 -XX:AllocatePrefetchLines=4 -XX:LoopUnrollLimit=45 -XX:InitialTenuringThreshold=12 -XX:MaxTenuringThreshold=15 -XX:ParallelGCThreads=28 -XX:InlineSmallCode=3900 -XX:MaxInlineSize=270 -XX:FreqInlineSize=2500 -XX:+AggressiveOpts -XX:+UseLargePages -XX:+UseParallelOldGC |
| JVM Affinity: | start /NODE [0,1,2,3] /AFFINITY [0xFFFFFFF] |
| JVM Instances: | 4 |
| JVM Initial Heap (MB): | 21000 |
| JVM Maximum Heap (MB): | 21000 |
| JVM Address Bits: | 64 |
| Boot Firmware Version: | I42 v2.00 (02/02/2019) |
| Management Firmware Version: | 1.40 Feb 05 2019 |
| Workload Version: | SSJ 1.2.10 |
| Director Location: | Controller |
| Other Software: | HPE Service Pack for ProLiant (SPP) Version: 2019.03.0, Microsoft Windows KB4056898, KB4338815 |
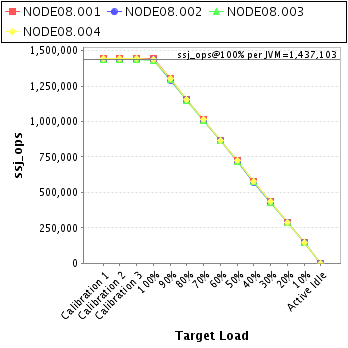
| JVM Instance | ssj_ops@100% |
|---|---|
| NODE08.001 | 1,442,353 |
| NODE08.002 | 1,435,160 |
| NODE08.003 | 1,429,481 |
| NODE08.004 | 1,441,417 |
| ssj_ops@100% | 5,748,411 |
| ssj_ops@100% per JVM | 1,437,103 |
| Target Load | Actual Load | ssj_ops | |
|---|---|---|---|
| Target | Actual | ||
| Calibration 1 | 1,443,870 | ||
| Calibration 2 | 1,446,725 | ||
| Calibration 3 | 1,446,063 | ||
| ssj_ops@calibrated=1,446,394 | |||
| 100% | 99.7% | 1,446,394 | 1,442,353 |
| 90% | 90.0% | 1,301,755 | 1,302,367 |
| 80% | 80.0% | 1,157,115 | 1,156,831 |
| 70% | 70.0% | 1,012,476 | 1,012,829 |
| 60% | 59.9% | 867,836 | 867,101 |
| 50% | 50.1% | 723,197 | 724,098 |
| 40% | 39.8% | 578,558 | 575,227 |
| 30% | 30.0% | 433,918 | 433,359 |
| 20% | 20.0% | 289,279 | 289,265 |
| 10% | 10.0% | 144,639 | 144,333 |
| Active Idle | 0 | 0 | |
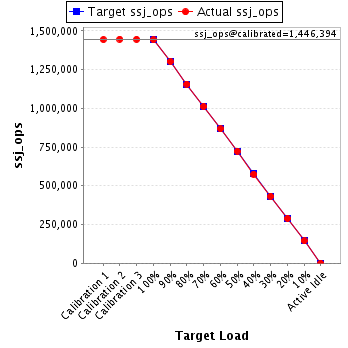
| Target Load | Actual Load | ssj_ops | |
|---|---|---|---|
| Target | Actual | ||
| Calibration 1 | 1,438,586 | ||
| Calibration 2 | 1,437,433 | ||
| Calibration 3 | 1,439,783 | ||
| ssj_ops@calibrated=1,438,608 | |||
| 100% | 99.8% | 1,438,608 | 1,435,160 |
| 90% | 89.9% | 1,294,747 | 1,293,257 |
| 80% | 80.1% | 1,150,886 | 1,152,704 |
| 70% | 69.9% | 1,007,026 | 1,005,174 |
| 60% | 60.2% | 863,165 | 865,346 |
| 50% | 50.1% | 719,304 | 720,961 |
| 40% | 39.8% | 575,443 | 572,808 |
| 30% | 29.8% | 431,582 | 429,272 |
| 20% | 20.0% | 287,722 | 287,680 |
| 10% | 10.1% | 143,861 | 144,825 |
| Active Idle | 0 | 0 | |

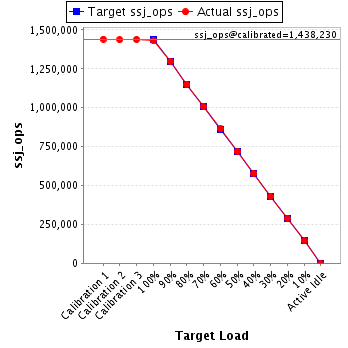
| Target Load | Actual Load | ssj_ops | |
|---|---|---|---|
| Target | Actual | ||
| Calibration 1 | 1,440,890 | ||
| Calibration 2 | 1,437,398 | ||
| Calibration 3 | 1,439,061 | ||
| ssj_ops@calibrated=1,438,230 | |||
| 100% | 99.4% | 1,438,230 | 1,429,481 |
| 90% | 90.3% | 1,294,407 | 1,298,503 |
| 80% | 80.1% | 1,150,584 | 1,151,534 |
| 70% | 70.0% | 1,006,761 | 1,007,137 |
| 60% | 60.0% | 862,938 | 863,579 |
| 50% | 50.0% | 719,115 | 719,223 |
| 40% | 40.1% | 575,292 | 577,445 |
| 30% | 30.0% | 431,469 | 431,493 |
| 20% | 20.1% | 287,646 | 288,661 |
| 10% | 10.0% | 143,823 | 143,908 |
| Active Idle | 0 | 0 | |
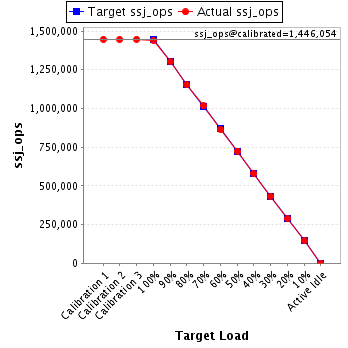
| Target Load | Actual Load | ssj_ops | |
|---|---|---|---|
| Target | Actual | ||
| Calibration 1 | 1,445,812 | ||
| Calibration 2 | 1,444,793 | ||
| Calibration 3 | 1,447,314 | ||
| ssj_ops@calibrated=1,446,054 | |||
| 100% | 99.7% | 1,446,054 | 1,441,417 |
| 90% | 90.0% | 1,301,448 | 1,300,750 |
| 80% | 79.7% | 1,156,843 | 1,153,012 |
| 70% | 70.3% | 1,012,238 | 1,016,863 |
| 60% | 59.8% | 867,632 | 865,443 |
| 50% | 50.1% | 723,027 | 724,274 |
| 40% | 40.0% | 578,421 | 578,251 |
| 30% | 29.9% | 433,816 | 432,825 |
| 20% | 20.1% | 289,211 | 289,937 |
| 10% | 10.1% | 144,605 | 145,654 |
| Active Idle | 0 | 0 | |