SPECpower_ssj2008
Host 'WIN-SUT101' Performance Report
Copyright © 2007-2019 Standard Performance Evaluation Corporation
| New H3C Technologies Co., Ltd. H3C UniServer B5700 G3 | ssj_ops@100% = 5,688,835 ssj_ops@100% per JVM = 1,422,209 |
||||
| Test Sponsor: | New H3C Technologies Co., Ltd. | SPEC License #: | 9066 | Test Method: | Multi Node |
| Tested By: | New H3C Technologies Co., Ltd. | Test Location: | Hangzhou, Zhejiang, China | Test Date: | May 15, 2019 |
| Hardware Availability: | Jan-2019 | Software Availability: | Jan-2019 | Publication: | Jun 12, 2019 |
| System Source: | Single Supplier | System Designation: | Server | Power Provisioning: | Line-powered |
| Target Load | Actual Load | ssj_ops | |
|---|---|---|---|
| Target | Actual | ||
| Calibration 1 | 5,703,101 | ||
| Calibration 2 | 5,698,381 | ||
| Calibration 3 | 5,703,683 | ||
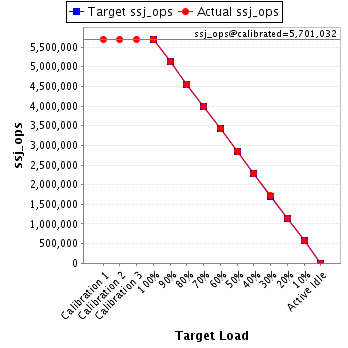
| ssj_ops@calibrated=5,701,032 | |||
| 100% | 99.8% | 5,701,032 | 5,688,835 |
| 90% | 90.0% | 5,130,929 | 5,128,371 |
| 80% | 80.0% | 4,560,826 | 4,561,528 |
| 70% | 69.9% | 3,990,722 | 3,984,368 |
| 60% | 59.9% | 3,420,619 | 3,417,500 |
| 50% | 50.0% | 2,850,516 | 2,850,294 |
| 40% | 40.0% | 2,280,413 | 2,280,699 |
| 30% | 30.1% | 1,710,310 | 1,715,677 |
| 20% | 20.0% | 1,140,206 | 1,137,994 |
| 10% | 10.0% | 570,103 | 570,705 |
| Active Idle | 0 | 0 | |
| Set Identifier: | sut |
| Set Description: | System Under Test |
| # of Identical Nodes: | 10 |
| Comment: | SUT |
| Hardware | |
|---|---|
| Hardware Vendor: | New H3C Technologies Co., Ltd. |
| Model: | H3C UniServer B5700 G3 |
| Form Factor: | Other |
| CPU Name: | Intel Xeon Platinum 8180 2.50GHz |
| CPU Characteristics: | 28-Core, 2.50 GHz, 38.5 MB L3 Cache |
| CPU Frequency (MHz): | 2500 |
| CPU(s) Enabled: | 56 cores, 2 chips, 28 cores/chip |
| Hardware Threads: | 112 (2 / core) |
| CPU(s) Orderable: | 1,2 chips |
| Primary Cache: | 32 KB I + 32 KB D on chip per core |
| Secondary Cache: | 1 MB I+D on chip per core |
| Tertiary Cache: | 39424 KB I+D on chip per chip |
| Other Cache: | None |
| Memory Amount (GB): | 192.0 |
| # and size of DIMM: | 12 x 16384 MB |
| Memory Details: | 12 x 16GB 2Rx8 PC4-2666-V ECC;slots A1, A2, A3, A4, A5, A6, B1, B2, B3, B4, B5, B6 populated |
| Power Supply Quantity and Rating (W): | None |
| Power Supply Details: | Shared |
| Disk Drive: | SATA DOM 128GB P/N DESSH-A28D09BCADCA |
| Disk Controller: | Integrated SATA controller |
| # and type of Network Interface Cards (NICs) Installed: | 1 x Intel I350 Gigabit Ethernet Controller |
| NICs Enabled in Firmware / OS / Connected: | 2/2/1 |
| Network Speed (Mbit): | 1000 |
| Keyboard: | None |
| Mouse: | None |
| Monitor: | None |
| Optical Drives: | No |
| Other Hardware: | None |
| Software | |
|---|---|
| Power Management: | Balanced Mode enabled in OS (see SUT Notes) |
| Operating System (OS): | Microsoft Windows Server 2012 R2 Datacenter |
| OS Version: | Version 6.3 (Build 9600) |
| Filesystem: | NTFS |
| JVM Vendor: | Oracle Corporation |
| JVM Version: | Java HotSpot(TM) 64-Bit Server VM (build 24.80-b11, mixed mode), version 1.7.0_80 |
| JVM Command-line Options: | -server -Xmn19g -Xms21g -Xmx21g -XX:SurvivorRatio=1 -XX:TargetSurvivorRatio=99 -XX:ParallelGCThreads=28 -XX:AllocatePrefetchDistance=256 -XX:AllocatePrefetchLines=4 -XX:LoopUnrollLimit=45 -XX:InitialTenuringThreshold=12 -XX:MaxTenuringThreshold=15 -XX:InlineSmallCode=9000 -XX:MaxInlineSize=270 -XX:FreqInlineSize=6000 -XX:+UseLargePages -XX:+UseParallelOldGC -XX:+AggressiveOpts |
| JVM Affinity: | start /NODE [0,2] /AFFINITY [0xFC0FF00FC0FF];start /NODE [1,3] /AFFINITY [0xFF03F00FF03F] |
| JVM Instances: | 4 |
| JVM Initial Heap (MB): | 21000 |
| JVM Maximum Heap (MB): | 21000 |
| JVM Address Bits: | 64 |
| Boot Firmware Version: | 2.00.25 |
| Management Firmware Version: | UIS-OM 1.00.10 |
| Workload Version: | SSJ 1.2.10 |
| Director Location: | Controller |
| Other Software: | Microsoft Windows KB3021910, clearcompressionflag.exe, KB2919355, KB2932046, KB2959977, KB2937592, KB2938439, KB2934018, KB4056898, patched to this test system in May 6, 2019 |
| JVM Instance | ssj_ops@100% |
|---|---|
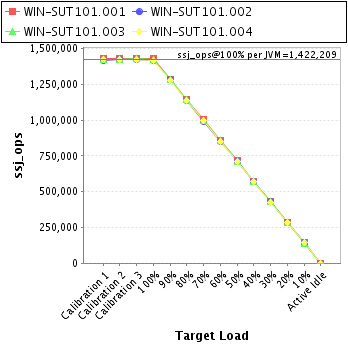
| WIN-SUT101.001 | 1,430,338 |
| WIN-SUT101.002 | 1,419,008 |
| WIN-SUT101.003 | 1,420,703 |
| WIN-SUT101.004 | 1,418,786 |
| ssj_ops@100% | 5,688,835 |
| ssj_ops@100% per JVM | 1,422,209 |
| Target Load | Actual Load | ssj_ops | |
|---|---|---|---|
| Target | Actual | ||
| Calibration 1 | 1,432,847 | ||
| Calibration 2 | 1,431,997 | ||
| Calibration 3 | 1,432,915 | ||
| ssj_ops@calibrated=1,432,456 | |||
| 100% | 99.9% | 1,432,456 | 1,430,338 |
| 90% | 89.8% | 1,289,211 | 1,286,883 |
| 80% | 80.0% | 1,145,965 | 1,146,523 |
| 70% | 70.0% | 1,002,719 | 1,002,065 |
| 60% | 60.1% | 859,474 | 860,501 |
| 50% | 50.0% | 716,228 | 716,827 |
| 40% | 39.9% | 572,982 | 572,160 |
| 30% | 30.1% | 429,737 | 430,852 |
| 20% | 19.9% | 286,491 | 285,498 |
| 10% | 10.1% | 143,246 | 144,473 |
| Active Idle | 0 | 0 | |

| Target Load | Actual Load | ssj_ops | |
|---|---|---|---|
| Target | Actual | ||
| Calibration 1 | 1,418,436 | ||
| Calibration 2 | 1,422,610 | ||
| Calibration 3 | 1,422,519 | ||
| ssj_ops@calibrated=1,422,564 | |||
| 100% | 99.8% | 1,422,564 | 1,419,008 |
| 90% | 90.0% | 1,280,308 | 1,280,973 |
| 80% | 79.9% | 1,138,051 | 1,137,278 |
| 70% | 69.8% | 995,795 | 992,622 |
| 60% | 59.8% | 853,539 | 851,367 |
| 50% | 50.1% | 711,282 | 713,082 |
| 40% | 40.0% | 569,026 | 569,411 |
| 30% | 30.1% | 426,769 | 428,114 |
| 20% | 20.0% | 284,513 | 284,362 |
| 10% | 10.0% | 142,256 | 141,756 |
| Active Idle | 0 | 0 | |

| Target Load | Actual Load | ssj_ops | |
|---|---|---|---|
| Target | Actual | ||
| Calibration 1 | 1,426,641 | ||
| Calibration 2 | 1,422,467 | ||
| Calibration 3 | 1,427,447 | ||
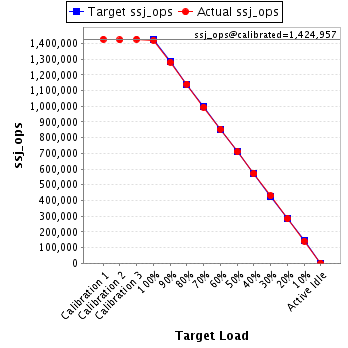
| ssj_ops@calibrated=1,424,957 | |||
| 100% | 99.7% | 1,424,957 | 1,420,703 |
| 90% | 89.9% | 1,282,461 | 1,280,511 |
| 80% | 80.1% | 1,139,965 | 1,140,810 |
| 70% | 69.8% | 997,470 | 995,116 |
| 60% | 60.0% | 854,974 | 854,796 |
| 50% | 49.9% | 712,478 | 710,520 |
| 40% | 40.1% | 569,983 | 570,746 |
| 30% | 30.1% | 427,487 | 429,473 |
| 20% | 19.9% | 284,991 | 283,779 |
| 10% | 9.9% | 142,496 | 141,390 |
| Active Idle | 0 | 0 | |
| Target Load | Actual Load | ssj_ops | |
|---|---|---|---|
| Target | Actual | ||
| Calibration 1 | 1,425,177 | ||
| Calibration 2 | 1,421,308 | ||
| Calibration 3 | 1,420,802 | ||
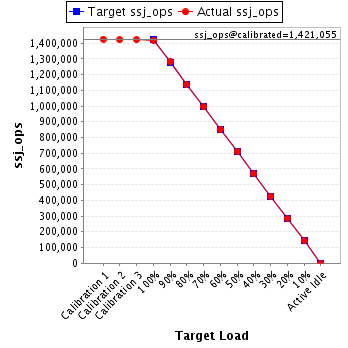
| ssj_ops@calibrated=1,421,055 | |||
| 100% | 99.8% | 1,421,055 | 1,418,786 |
| 90% | 90.1% | 1,278,950 | 1,280,004 |
| 80% | 80.0% | 1,136,844 | 1,136,917 |
| 70% | 70.0% | 994,739 | 994,564 |
| 60% | 59.9% | 852,633 | 850,837 |
| 50% | 50.0% | 710,528 | 709,864 |
| 40% | 40.0% | 568,422 | 568,381 |
| 30% | 30.1% | 426,317 | 427,238 |
| 20% | 20.0% | 284,211 | 284,356 |
| 10% | 10.1% | 142,106 | 143,086 |
| Active Idle | 0 | 0 | |