SPECpower_ssj2008
Host 'WIN-SUT102' Performance Report
Copyright © 2007-2019 Standard Performance Evaluation Corporation
| New H3C Technologies Co., Ltd. H3C UniServer B5700 G3 | ssj_ops@100% = 5,711,436 ssj_ops@100% per JVM = 1,427,859 |
||||
| Test Sponsor: | New H3C Technologies Co., Ltd. | SPEC License #: | 9066 | Test Method: | Multi Node |
| Tested By: | New H3C Technologies Co., Ltd. | Test Location: | Hangzhou, Zhejiang, China | Test Date: | May 15, 2019 |
| Hardware Availability: | Jan-2019 | Software Availability: | Jan-2019 | Publication: | Jun 12, 2019 |
| System Source: | Single Supplier | System Designation: | Server | Power Provisioning: | Line-powered |
| Target Load | Actual Load | ssj_ops | |
|---|---|---|---|
| Target | Actual | ||
| Calibration 1 | 5,737,847 | ||
| Calibration 2 | 5,725,523 | ||
| Calibration 3 | 5,740,716 | ||
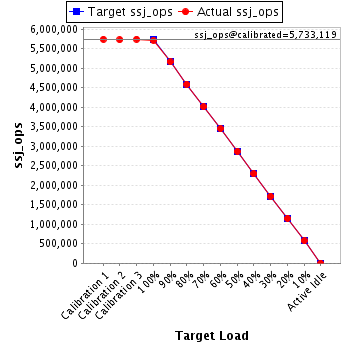
| ssj_ops@calibrated=5,733,119 | |||
| 100% | 99.6% | 5,733,119 | 5,711,436 |
| 90% | 90.0% | 5,159,808 | 5,157,932 |
| 80% | 80.0% | 4,586,496 | 4,584,537 |
| 70% | 69.9% | 4,013,184 | 4,009,359 |
| 60% | 60.1% | 3,439,872 | 3,445,456 |
| 50% | 50.0% | 2,866,560 | 2,864,806 |
| 40% | 40.0% | 2,293,248 | 2,290,405 |
| 30% | 30.0% | 1,719,936 | 1,719,063 |
| 20% | 20.0% | 1,146,624 | 1,149,078 |
| 10% | 10.1% | 573,312 | 576,602 |
| Active Idle | 0 | 0 | |
| Set Identifier: | sut |
| Set Description: | System Under Test |
| # of Identical Nodes: | 10 |
| Comment: | SUT |
| Hardware | |
|---|---|
| Hardware Vendor: | New H3C Technologies Co., Ltd. |
| Model: | H3C UniServer B5700 G3 |
| Form Factor: | Other |
| CPU Name: | Intel Xeon Platinum 8180 2.50GHz |
| CPU Characteristics: | 28-Core, 2.50 GHz, 38.5 MB L3 Cache |
| CPU Frequency (MHz): | 2500 |
| CPU(s) Enabled: | 56 cores, 2 chips, 28 cores/chip |
| Hardware Threads: | 112 (2 / core) |
| CPU(s) Orderable: | 1,2 chips |
| Primary Cache: | 32 KB I + 32 KB D on chip per core |
| Secondary Cache: | 1 MB I+D on chip per core |
| Tertiary Cache: | 39424 KB I+D on chip per chip |
| Other Cache: | None |
| Memory Amount (GB): | 192.0 |
| # and size of DIMM: | 12 x 16384 MB |
| Memory Details: | 12 x 16GB 2Rx8 PC4-2666-V ECC;slots A1, A2, A3, A4, A5, A6, B1, B2, B3, B4, B5, B6 populated |
| Power Supply Quantity and Rating (W): | None |
| Power Supply Details: | Shared |
| Disk Drive: | SATA DOM 128GB P/N DESSH-A28D09BCADCA |
| Disk Controller: | Integrated SATA controller |
| # and type of Network Interface Cards (NICs) Installed: | 1 x Intel I350 Gigabit Ethernet Controller |
| NICs Enabled in Firmware / OS / Connected: | 2/2/1 |
| Network Speed (Mbit): | 1000 |
| Keyboard: | None |
| Mouse: | None |
| Monitor: | None |
| Optical Drives: | No |
| Other Hardware: | None |
| Software | |
|---|---|
| Power Management: | Balanced Mode enabled in OS (see SUT Notes) |
| Operating System (OS): | Microsoft Windows Server 2012 R2 Datacenter |
| OS Version: | Version 6.3 (Build 9600) |
| Filesystem: | NTFS |
| JVM Vendor: | Oracle Corporation |
| JVM Version: | Java HotSpot(TM) 64-Bit Server VM (build 24.80-b11, mixed mode), version 1.7.0_80 |
| JVM Command-line Options: | -server -Xmn19g -Xms21g -Xmx21g -XX:SurvivorRatio=1 -XX:TargetSurvivorRatio=99 -XX:ParallelGCThreads=28 -XX:AllocatePrefetchDistance=256 -XX:AllocatePrefetchLines=4 -XX:LoopUnrollLimit=45 -XX:InitialTenuringThreshold=12 -XX:MaxTenuringThreshold=15 -XX:InlineSmallCode=9000 -XX:MaxInlineSize=270 -XX:FreqInlineSize=6000 -XX:+UseLargePages -XX:+UseParallelOldGC -XX:+AggressiveOpts |
| JVM Affinity: | start /NODE [0,2] /AFFINITY [0xFC0FF00FC0FF];start /NODE [1,3] /AFFINITY [0xFF03F00FF03F] |
| JVM Instances: | 4 |
| JVM Initial Heap (MB): | 21000 |
| JVM Maximum Heap (MB): | 21000 |
| JVM Address Bits: | 64 |
| Boot Firmware Version: | 2.00.25 |
| Management Firmware Version: | UIS-OM 1.00.10 |
| Workload Version: | SSJ 1.2.10 |
| Director Location: | Controller |
| Other Software: | Microsoft Windows KB3021910, clearcompressionflag.exe, KB2919355, KB2932046, KB2959977, KB2937592, KB2938439, KB2934018, KB4056898, patched to this test system in May 6, 2019 |
| JVM Instance | ssj_ops@100% |
|---|---|
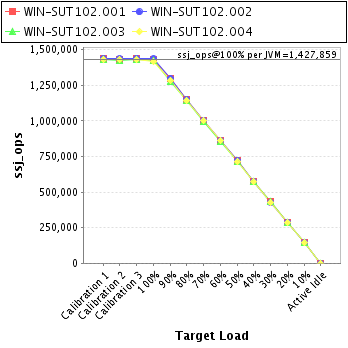
| WIN-SUT102.001 | 1,432,097 |
| WIN-SUT102.002 | 1,435,268 |
| WIN-SUT102.003 | 1,425,270 |
| WIN-SUT102.004 | 1,418,801 |
| ssj_ops@100% | 5,711,436 |
| ssj_ops@100% per JVM | 1,427,859 |
| Target Load | Actual Load | ssj_ops | |
|---|---|---|---|
| Target | Actual | ||
| Calibration 1 | 1,435,484 | ||
| Calibration 2 | 1,434,068 | ||
| Calibration 3 | 1,438,536 | ||
| ssj_ops@calibrated=1,436,302 | |||
| 100% | 99.7% | 1,436,302 | 1,432,097 |
| 90% | 90.2% | 1,292,671 | 1,295,626 |
| 80% | 79.9% | 1,149,041 | 1,148,055 |
| 70% | 70.0% | 1,005,411 | 1,006,056 |
| 60% | 60.1% | 861,781 | 863,021 |
| 50% | 50.0% | 718,151 | 718,832 |
| 40% | 39.9% | 574,521 | 572,382 |
| 30% | 30.0% | 430,890 | 430,351 |
| 20% | 19.9% | 287,260 | 285,516 |
| 10% | 10.0% | 143,630 | 143,777 |
| Active Idle | 0 | 0 | |
| Target Load | Actual Load | ssj_ops | |
|---|---|---|---|
| Target | Actual | ||
| Calibration 1 | 1,438,586 | ||
| Calibration 2 | 1,437,707 | ||
| Calibration 3 | 1,440,571 | ||
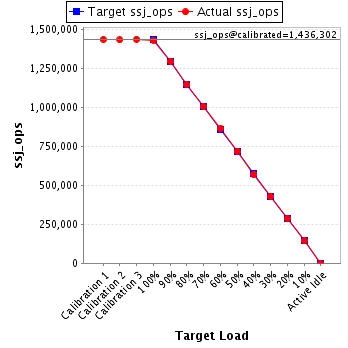
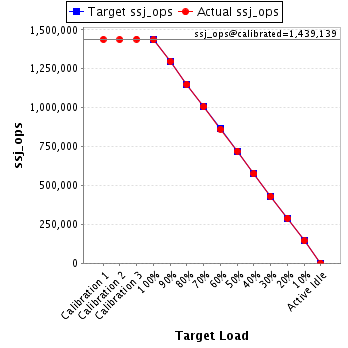
| ssj_ops@calibrated=1,439,139 | |||
| 100% | 99.7% | 1,439,139 | 1,435,268 |
| 90% | 90.2% | 1,295,225 | 1,297,657 |
| 80% | 79.9% | 1,151,311 | 1,149,221 |
| 70% | 69.9% | 1,007,397 | 1,006,161 |
| 60% | 59.9% | 863,483 | 862,364 |
| 50% | 50.1% | 719,569 | 720,691 |
| 40% | 39.9% | 575,656 | 574,346 |
| 30% | 29.9% | 431,742 | 429,596 |
| 20% | 20.1% | 287,828 | 289,794 |
| 10% | 10.1% | 143,914 | 144,749 |
| Active Idle | 0 | 0 | |
| Target Load | Actual Load | ssj_ops | |
|---|---|---|---|
| Target | Actual | ||
| Calibration 1 | 1,430,178 | ||
| Calibration 2 | 1,424,701 | ||
| Calibration 3 | 1,430,638 | ||
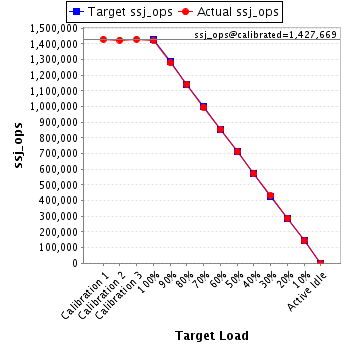
| ssj_ops@calibrated=1,427,669 | |||
| 100% | 99.8% | 1,427,669 | 1,425,270 |
| 90% | 89.6% | 1,284,902 | 1,279,470 |
| 80% | 80.1% | 1,142,136 | 1,143,599 |
| 70% | 69.8% | 999,369 | 997,225 |
| 60% | 60.0% | 856,602 | 856,590 |
| 50% | 49.9% | 713,835 | 713,037 |
| 40% | 40.1% | 571,068 | 571,873 |
| 30% | 30.2% | 428,301 | 430,684 |
| 20% | 20.2% | 285,534 | 287,722 |
| 10% | 10.1% | 142,767 | 143,904 |
| Active Idle | 0 | 0 | |
| Target Load | Actual Load | ssj_ops | |
|---|---|---|---|
| Target | Actual | ||
| Calibration 1 | 1,433,599 | ||
| Calibration 2 | 1,429,047 | ||
| Calibration 3 | 1,430,972 | ||
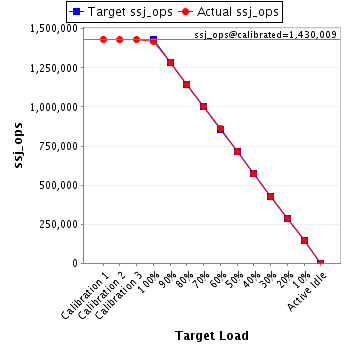
| ssj_ops@calibrated=1,430,009 | |||
| 100% | 99.2% | 1,430,009 | 1,418,801 |
| 90% | 89.9% | 1,287,009 | 1,285,180 |
| 80% | 80.0% | 1,144,008 | 1,143,661 |
| 70% | 69.9% | 1,001,007 | 999,917 |
| 60% | 60.4% | 858,006 | 863,481 |
| 50% | 49.8% | 715,005 | 712,246 |
| 40% | 40.0% | 572,004 | 571,805 |
| 30% | 30.0% | 429,003 | 428,431 |
| 20% | 20.0% | 286,002 | 286,045 |
| 10% | 10.1% | 143,001 | 144,173 |
| Active Idle | 0 | 0 | |