SPECpower_ssj2008
Host 'WIN-SUT109' Performance Report
Copyright © 2007-2019 Standard Performance Evaluation Corporation
| New H3C Technologies Co., Ltd. H3C UniServer B5700 G3 | ssj_ops@100% = 5,667,214 ssj_ops@100% per JVM = 1,416,803 |
||||
| Test Sponsor: | New H3C Technologies Co., Ltd. | SPEC License #: | 9066 | Test Method: | Multi Node |
| Tested By: | New H3C Technologies Co., Ltd. | Test Location: | Hangzhou, Zhejiang, China | Test Date: | May 15, 2019 |
| Hardware Availability: | Jan-2019 | Software Availability: | Jan-2019 | Publication: | Jun 12, 2019 |
| System Source: | Single Supplier | System Designation: | Server | Power Provisioning: | Line-powered |
| Target Load | Actual Load | ssj_ops | |
|---|---|---|---|
| Target | Actual | ||
| Calibration 1 | 5,681,272 | ||
| Calibration 2 | 5,671,828 | ||
| Calibration 3 | 5,683,202 | ||
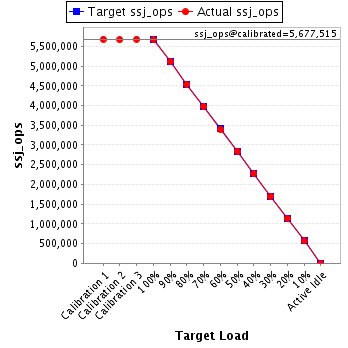
| ssj_ops@calibrated=5,677,515 | |||
| 100% | 99.8% | 5,677,515 | 5,667,214 |
| 90% | 90.0% | 5,109,764 | 5,109,869 |
| 80% | 79.9% | 4,542,012 | 4,536,837 |
| 70% | 70.0% | 3,974,261 | 3,973,144 |
| 60% | 59.8% | 3,406,509 | 3,397,438 |
| 50% | 50.1% | 2,838,758 | 2,842,067 |
| 40% | 40.0% | 2,271,006 | 2,268,624 |
| 30% | 29.9% | 1,703,255 | 1,700,398 |
| 20% | 20.0% | 1,135,503 | 1,136,331 |
| 10% | 9.9% | 567,752 | 564,663 |
| Active Idle | 0 | 0 | |
| Set Identifier: | sut |
| Set Description: | System Under Test |
| # of Identical Nodes: | 10 |
| Comment: | SUT |
| Hardware | |
|---|---|
| Hardware Vendor: | New H3C Technologies Co., Ltd. |
| Model: | H3C UniServer B5700 G3 |
| Form Factor: | Other |
| CPU Name: | Intel Xeon Platinum 8180 2.50GHz |
| CPU Characteristics: | 28-Core, 2.50 GHz, 38.5 MB L3 Cache |
| CPU Frequency (MHz): | 2500 |
| CPU(s) Enabled: | 56 cores, 2 chips, 28 cores/chip |
| Hardware Threads: | 112 (2 / core) |
| CPU(s) Orderable: | 1,2 chips |
| Primary Cache: | 32 KB I + 32 KB D on chip per core |
| Secondary Cache: | 1 MB I+D on chip per core |
| Tertiary Cache: | 39424 KB I+D on chip per chip |
| Other Cache: | None |
| Memory Amount (GB): | 192.0 |
| # and size of DIMM: | 12 x 16384 MB |
| Memory Details: | 12 x 16GB 2Rx8 PC4-2666-V ECC;slots A1, A2, A3, A4, A5, A6, B1, B2, B3, B4, B5, B6 populated |
| Power Supply Quantity and Rating (W): | None |
| Power Supply Details: | Shared |
| Disk Drive: | SATA DOM 128GB P/N DESSH-A28D09BCADCA |
| Disk Controller: | Integrated SATA controller |
| # and type of Network Interface Cards (NICs) Installed: | 1 x Intel I350 Gigabit Ethernet Controller |
| NICs Enabled in Firmware / OS / Connected: | 2/2/1 |
| Network Speed (Mbit): | 1000 |
| Keyboard: | None |
| Mouse: | None |
| Monitor: | None |
| Optical Drives: | No |
| Other Hardware: | None |
| Software | |
|---|---|
| Power Management: | Balanced Mode enabled in OS (see SUT Notes) |
| Operating System (OS): | Microsoft Windows Server 2012 R2 Datacenter |
| OS Version: | Version 6.3 (Build 9600) |
| Filesystem: | NTFS |
| JVM Vendor: | Oracle Corporation |
| JVM Version: | Java HotSpot(TM) 64-Bit Server VM (build 24.80-b11, mixed mode), version 1.7.0_80 |
| JVM Command-line Options: | -server -Xmn19g -Xms21g -Xmx21g -XX:SurvivorRatio=1 -XX:TargetSurvivorRatio=99 -XX:ParallelGCThreads=28 -XX:AllocatePrefetchDistance=256 -XX:AllocatePrefetchLines=4 -XX:LoopUnrollLimit=45 -XX:InitialTenuringThreshold=12 -XX:MaxTenuringThreshold=15 -XX:InlineSmallCode=9000 -XX:MaxInlineSize=270 -XX:FreqInlineSize=6000 -XX:+UseLargePages -XX:+UseParallelOldGC -XX:+AggressiveOpts |
| JVM Affinity: | start /NODE [0,2] /AFFINITY [0xFC0FF00FC0FF];start /NODE [1,3] /AFFINITY [0xFF03F00FF03F] |
| JVM Instances: | 4 |
| JVM Initial Heap (MB): | 21000 |
| JVM Maximum Heap (MB): | 21000 |
| JVM Address Bits: | 64 |
| Boot Firmware Version: | 2.00.25 |
| Management Firmware Version: | UIS-OM 1.00.10 |
| Workload Version: | SSJ 1.2.10 |
| Director Location: | Controller |
| Other Software: | Microsoft Windows KB3021910, clearcompressionflag.exe, KB2919355, KB2932046, KB2959977, KB2937592, KB2938439, KB2934018, KB4056898, patched to this test system in May 6, 2019 |
| JVM Instance | ssj_ops@100% |
|---|---|
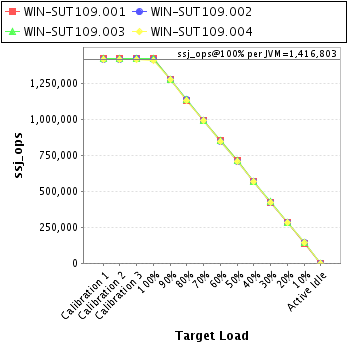
| WIN-SUT109.001 | 1,421,939 |
| WIN-SUT109.002 | 1,415,628 |
| WIN-SUT109.003 | 1,419,932 |
| WIN-SUT109.004 | 1,409,714 |
| ssj_ops@100% | 5,667,214 |
| ssj_ops@100% per JVM | 1,416,803 |
| Target Load | Actual Load | ssj_ops | |
|---|---|---|---|
| Target | Actual | ||
| Calibration 1 | 1,424,486 | ||
| Calibration 2 | 1,419,854 | ||
| Calibration 3 | 1,423,128 | ||
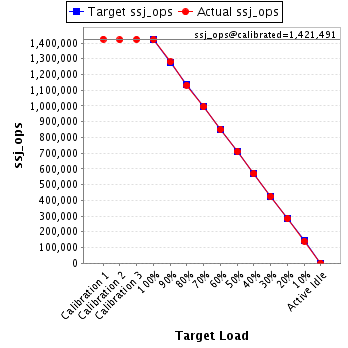
| ssj_ops@calibrated=1,421,491 | |||
| 100% | 100.0% | 1,421,491 | 1,421,939 |
| 90% | 90.0% | 1,279,342 | 1,279,531 |
| 80% | 79.6% | 1,137,193 | 1,132,043 |
| 70% | 70.0% | 995,043 | 995,035 |
| 60% | 59.8% | 852,894 | 850,134 |
| 50% | 50.0% | 710,745 | 710,691 |
| 40% | 40.0% | 568,596 | 568,694 |
| 30% | 29.9% | 426,447 | 425,040 |
| 20% | 20.0% | 284,298 | 283,854 |
| 10% | 9.9% | 142,149 | 140,038 |
| Active Idle | 0 | 0 | |
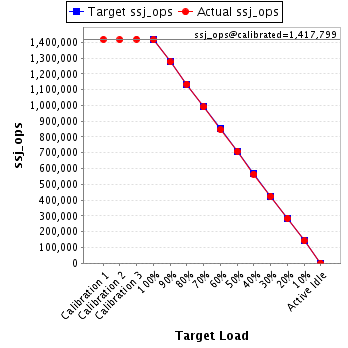
| Target Load | Actual Load | ssj_ops | |
|---|---|---|---|
| Target | Actual | ||
| Calibration 1 | 1,417,307 | ||
| Calibration 2 | 1,415,832 | ||
| Calibration 3 | 1,419,765 | ||
| ssj_ops@calibrated=1,417,799 | |||
| 100% | 99.8% | 1,417,799 | 1,415,628 |
| 90% | 90.0% | 1,276,019 | 1,276,049 |
| 80% | 80.0% | 1,134,239 | 1,134,183 |
| 70% | 69.8% | 992,459 | 990,166 |
| 60% | 59.7% | 850,679 | 846,780 |
| 50% | 50.0% | 708,899 | 708,852 |
| 40% | 39.9% | 567,119 | 565,082 |
| 30% | 29.9% | 425,340 | 424,162 |
| 20% | 20.0% | 283,560 | 284,149 |
| 10% | 10.1% | 141,780 | 142,499 |
| Active Idle | 0 | 0 | |
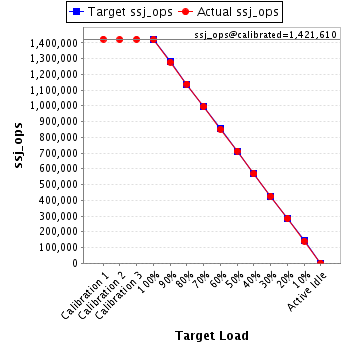
| Target Load | Actual Load | ssj_ops | |
|---|---|---|---|
| Target | Actual | ||
| Calibration 1 | 1,423,229 | ||
| Calibration 2 | 1,420,257 | ||
| Calibration 3 | 1,422,963 | ||
| ssj_ops@calibrated=1,421,610 | |||
| 100% | 99.9% | 1,421,610 | 1,419,932 |
| 90% | 89.9% | 1,279,449 | 1,277,634 |
| 80% | 80.1% | 1,137,288 | 1,138,493 |
| 70% | 70.0% | 995,127 | 994,526 |
| 60% | 59.9% | 852,966 | 852,223 |
| 50% | 50.1% | 710,805 | 712,633 |
| 40% | 39.9% | 568,644 | 567,643 |
| 30% | 30.0% | 426,483 | 426,127 |
| 20% | 20.0% | 284,322 | 284,537 |
| 10% | 9.9% | 142,161 | 140,881 |
| Active Idle | 0 | 0 | |
| Target Load | Actual Load | ssj_ops | |
|---|---|---|---|
| Target | Actual | ||
| Calibration 1 | 1,416,250 | ||
| Calibration 2 | 1,415,885 | ||
| Calibration 3 | 1,417,346 | ||
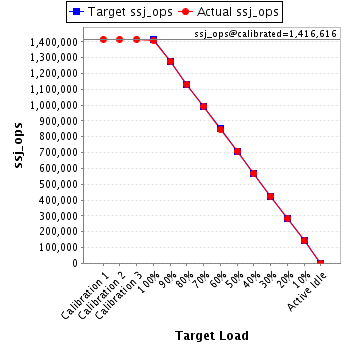
| ssj_ops@calibrated=1,416,616 | |||
| 100% | 99.5% | 1,416,616 | 1,409,714 |
| 90% | 90.1% | 1,274,954 | 1,276,655 |
| 80% | 79.9% | 1,133,293 | 1,132,118 |
| 70% | 70.1% | 991,631 | 993,417 |
| 60% | 59.9% | 849,969 | 848,302 |
| 50% | 50.1% | 708,308 | 709,891 |
| 40% | 40.0% | 566,646 | 567,205 |
| 30% | 30.0% | 424,985 | 425,068 |
| 20% | 20.0% | 283,323 | 283,790 |
| 10% | 10.0% | 141,662 | 141,245 |
| Active Idle | 0 | 0 | |