SPECpower_ssj2008
Host 'WIN-SUT104' Performance Report
Copyright © 2007-2019 Standard Performance Evaluation Corporation
| New H3C Technologies Co., Ltd. H3C UniServer B5700 G3 | ssj_ops@100% = 5,685,582 ssj_ops@100% per JVM = 1,421,395 |
||||
| Test Sponsor: | New H3C Technologies Co., Ltd. | SPEC License #: | 9066 | Test Method: | Multi Node |
| Tested By: | New H3C Technologies Co., Ltd. | Test Location: | Hangzhou, Zhejiang, China | Test Date: | May 14, 2019 |
| Hardware Availability: | Jan-2019 | Software Availability: | Jan-2019 | Publication: | Jun 12, 2019 |
| System Source: | Single Supplier | System Designation: | Server | Power Provisioning: | Line-powered |
| Target Load | Actual Load | ssj_ops | |
|---|---|---|---|
| Target | Actual | ||
| Calibration 1 | 5,697,682 | ||
| Calibration 2 | 5,686,889 | ||
| Calibration 3 | 5,699,306 | ||
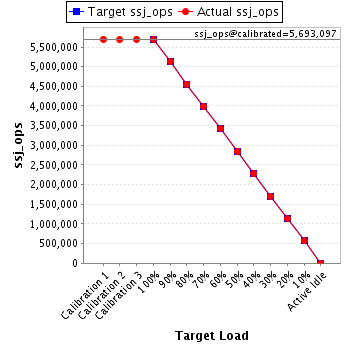
| ssj_ops@calibrated=5,693,097 | |||
| 100% | 99.9% | 5,693,097 | 5,685,582 |
| 90% | 90.1% | 5,123,788 | 5,131,507 |
| 80% | 80.0% | 4,554,478 | 4,552,289 |
| 70% | 70.1% | 3,985,168 | 3,988,830 |
| 60% | 60.1% | 3,415,858 | 3,423,099 |
| 50% | 50.0% | 2,846,549 | 2,845,834 |
| 40% | 40.0% | 2,277,239 | 2,276,904 |
| 30% | 29.9% | 1,707,929 | 1,703,604 |
| 20% | 20.1% | 1,138,619 | 1,142,467 |
| 10% | 10.0% | 569,310 | 568,429 |
| Active Idle | 0 | 0 | |
| Set Identifier: | sut |
| Set Description: | System Under Test |
| # of Identical Nodes: | 11 |
| Comment: | SUT |
| Hardware | |
|---|---|
| Hardware Vendor: | New H3C Technologies Co., Ltd. |
| Model: | H3C UniServer B5700 G3 |
| Form Factor: | Other |
| CPU Name: | Intel Xeon Platinum 8180 2.50GHz |
| CPU Characteristics: | 28-Core, 2.50 GHz, 38.5 MB L3 Cache |
| CPU Frequency (MHz): | 2500 |
| CPU(s) Enabled: | 56 cores, 2 chips, 28 cores/chip |
| Hardware Threads: | 112 (2 / core) |
| CPU(s) Orderable: | 1,2 chips |
| Primary Cache: | 32 KB I + 32 KB D on chip per core |
| Secondary Cache: | 1 MB I+D on chip per core |
| Tertiary Cache: | 39424 KB I+D on chip per chip |
| Other Cache: | None |
| Memory Amount (GB): | 192.0 |
| # and size of DIMM: | 12 x 16384 MB |
| Memory Details: | 12 x 16GB 2Rx8 PC4-2666-V ECC;slots A1, A2, A3, A4, A5, A6, B1, B2, B3, B4, B5, B6 populated |
| Power Supply Quantity and Rating (W): | None |
| Power Supply Details: | Shared |
| Disk Drive: | SATA DOM 128GB P/N DESSH-A28D09BCADCA |
| Disk Controller: | Integrated SATA controller |
| # and type of Network Interface Cards (NICs) Installed: | 1 x Intel I350 Gigabit Ethernet Controller |
| NICs Enabled in Firmware / OS / Connected: | 2/2/1 |
| Network Speed (Mbit): | 1000 |
| Keyboard: | None |
| Mouse: | None |
| Monitor: | None |
| Optical Drives: | No |
| Other Hardware: | None |
| Software | |
|---|---|
| Power Management: | Balanced Mode enabled in OS (see SUT Notes) |
| Operating System (OS): | Microsoft Windows Server 2012 R2 Datacenter |
| OS Version: | Version 6.3 (Build 9600) |
| Filesystem: | NTFS |
| JVM Vendor: | Oracle Corporation |
| JVM Version: | Java HotSpot(TM) 64-Bit Server VM (build 24.80-b11, mixed mode), version 1.7.0_80 |
| JVM Command-line Options: | -server -Xmn19g -Xms21g -Xmx21g -XX:SurvivorRatio=1 -XX:TargetSurvivorRatio=99 -XX:ParallelGCThreads=28 -XX:AllocatePrefetchDistance=256 -XX:AllocatePrefetchLines=4 -XX:LoopUnrollLimit=45 -XX:InitialTenuringThreshold=12 -XX:MaxTenuringThreshold=15 -XX:InlineSmallCode=9000 -XX:MaxInlineSize=270 -XX:FreqInlineSize=6000 -XX:+UseLargePages -XX:+UseParallelOldGC -XX:+AggressiveOpts |
| JVM Affinity: | start /NODE [0,2] /AFFINITY [0xFC0FF00FC0FF];start /NODE [1,3] /AFFINITY [0xFF03F00FF03F] |
| JVM Instances: | 4 |
| JVM Initial Heap (MB): | 21000 |
| JVM Maximum Heap (MB): | 21000 |
| JVM Address Bits: | 64 |
| Boot Firmware Version: | 2.00.25 |
| Management Firmware Version: | UIS-OM 1.00.10 |
| Workload Version: | SSJ 1.2.10 |
| Director Location: | Controller |
| Other Software: | Microsoft Windows KB3021910, clearcompressionflag.exe, KB2919355, KB2932046, KB2959977, KB2937592, KB2938439, KB2934018, KB4056898, patched to this test system in May 7,2019 |
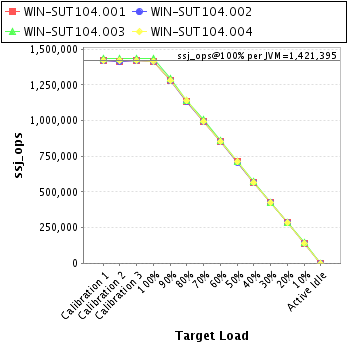
| JVM Instance | ssj_ops@100% |
|---|---|
| WIN-SUT104.001 | 1,417,605 |
| WIN-SUT104.002 | 1,414,827 |
| WIN-SUT104.003 | 1,435,178 |
| WIN-SUT104.004 | 1,417,971 |
| ssj_ops@100% | 5,685,582 |
| ssj_ops@100% per JVM | 1,421,395 |
| Target Load | Actual Load | ssj_ops | |
|---|---|---|---|
| Target | Actual | ||
| Calibration 1 | 1,420,524 | ||
| Calibration 2 | 1,417,217 | ||
| Calibration 3 | 1,419,157 | ||
| ssj_ops@calibrated=1,418,187 | |||
| 100% | 100.0% | 1,418,187 | 1,417,605 |
| 90% | 90.1% | 1,276,368 | 1,277,865 |
| 80% | 80.2% | 1,134,549 | 1,136,813 |
| 70% | 70.2% | 992,731 | 995,518 |
| 60% | 60.0% | 850,912 | 851,168 |
| 50% | 50.1% | 709,093 | 709,936 |
| 40% | 39.9% | 567,275 | 566,277 |
| 30% | 29.9% | 425,456 | 424,518 |
| 20% | 20.1% | 283,637 | 285,176 |
| 10% | 10.0% | 141,819 | 141,842 |
| Active Idle | 0 | 0 | |

| Target Load | Actual Load | ssj_ops | |
|---|---|---|---|
| Target | Actual | ||
| Calibration 1 | 1,418,525 | ||
| Calibration 2 | 1,415,151 | ||
| Calibration 3 | 1,419,842 | ||
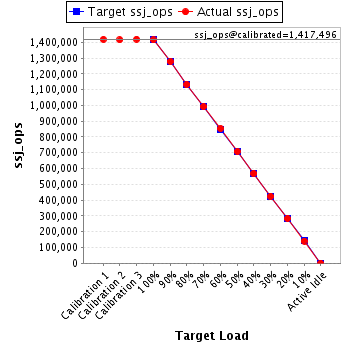
| ssj_ops@calibrated=1,417,496 | |||
| 100% | 99.8% | 1,417,496 | 1,414,827 |
| 90% | 90.2% | 1,275,747 | 1,278,552 |
| 80% | 79.9% | 1,133,997 | 1,132,645 |
| 70% | 70.0% | 992,247 | 992,738 |
| 60% | 60.3% | 850,498 | 854,682 |
| 50% | 50.0% | 708,748 | 708,452 |
| 40% | 40.1% | 566,999 | 568,249 |
| 30% | 30.0% | 425,249 | 424,844 |
| 20% | 20.0% | 283,499 | 283,733 |
| 10% | 9.9% | 141,750 | 141,006 |
| Active Idle | 0 | 0 | |
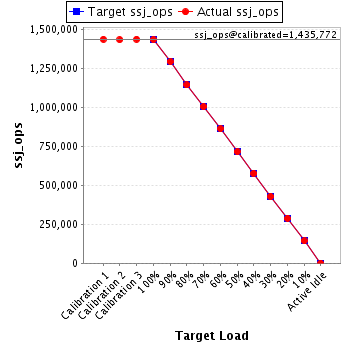
| Target Load | Actual Load | ssj_ops | |
|---|---|---|---|
| Target | Actual | ||
| Calibration 1 | 1,437,215 | ||
| Calibration 2 | 1,433,743 | ||
| Calibration 3 | 1,437,800 | ||
| ssj_ops@calibrated=1,435,772 | |||
| 100% | 100.0% | 1,435,772 | 1,435,178 |
| 90% | 90.1% | 1,292,195 | 1,293,334 |
| 80% | 79.7% | 1,148,617 | 1,144,129 |
| 70% | 70.0% | 1,005,040 | 1,005,327 |
| 60% | 60.1% | 861,463 | 862,236 |
| 50% | 49.8% | 717,886 | 715,596 |
| 40% | 40.1% | 574,309 | 576,210 |
| 30% | 29.8% | 430,732 | 428,128 |
| 20% | 20.1% | 287,154 | 288,571 |
| 10% | 10.0% | 143,577 | 143,682 |
| Active Idle | 0 | 0 | |
| Target Load | Actual Load | ssj_ops | |
|---|---|---|---|
| Target | Actual | ||
| Calibration 1 | 1,421,418 | ||
| Calibration 2 | 1,420,778 | ||
| Calibration 3 | 1,422,508 | ||
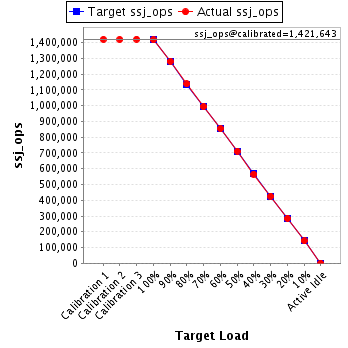
| ssj_ops@calibrated=1,421,643 | |||
| 100% | 99.7% | 1,421,643 | 1,417,971 |
| 90% | 90.2% | 1,279,478 | 1,281,756 |
| 80% | 80.1% | 1,137,314 | 1,138,702 |
| 70% | 70.0% | 995,150 | 995,247 |
| 60% | 60.1% | 852,986 | 855,013 |
| 50% | 50.1% | 710,821 | 711,849 |
| 40% | 39.8% | 568,657 | 566,168 |
| 30% | 30.0% | 426,493 | 426,113 |
| 20% | 20.0% | 284,329 | 284,987 |
| 10% | 10.0% | 142,164 | 141,900 |
| Active Idle | 0 | 0 | |