
SPECpower_ssj2008
Host 'WIN-SUT105' Performance Report
Copyright © 2007-2019 Standard Performance Evaluation Corporation
| New H3C Technologies Co., Ltd. H3C UniServer B5700 G3 | ssj_ops@100% = 5,686,793 ssj_ops@100% per JVM = 1,421,698 |
||||
| Test Sponsor: | New H3C Technologies Co., Ltd. | SPEC License #: | 9066 | Test Method: | Multi Node |
| Tested By: | New H3C Technologies Co., Ltd. | Test Location: | Hangzhou, Zhejiang, China | Test Date: | May 14, 2019 |
| Hardware Availability: | Jan-2019 | Software Availability: | Jan-2019 | Publication: | Jun 12, 2019 |
| System Source: | Single Supplier | System Designation: | Server | Power Provisioning: | Line-powered |
| Target Load | Actual Load | ssj_ops | |
|---|---|---|---|
| Target | Actual | ||
| Calibration 1 | 5,694,161 | ||
| Calibration 2 | 5,694,209 | ||
| Calibration 3 | 5,701,480 | ||
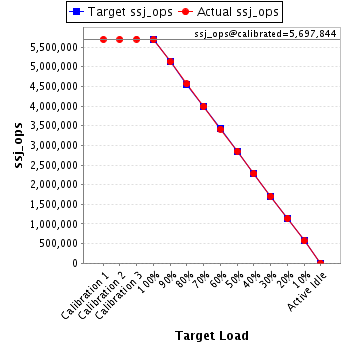
| ssj_ops@calibrated=5,697,844 | |||
| 100% | 99.8% | 5,697,844 | 5,686,793 |
| 90% | 90.0% | 5,128,060 | 5,127,236 |
| 80% | 80.1% | 4,558,275 | 4,562,738 |
| 70% | 70.1% | 3,988,491 | 3,991,468 |
| 60% | 59.9% | 3,418,707 | 3,415,300 |
| 50% | 50.0% | 2,848,922 | 2,851,235 |
| 40% | 40.0% | 2,279,138 | 2,277,095 |
| 30% | 29.9% | 1,709,353 | 1,705,666 |
| 20% | 20.0% | 1,139,569 | 1,142,140 |
| 10% | 10.0% | 569,784 | 568,611 |
| Active Idle | 0 | 0 | |
| Set Identifier: | sut |
| Set Description: | System Under Test |
| # of Identical Nodes: | 11 |
| Comment: | SUT |
| Hardware | |
|---|---|
| Hardware Vendor: | New H3C Technologies Co., Ltd. |
| Model: | H3C UniServer B5700 G3 |
| Form Factor: | Other |
| CPU Name: | Intel Xeon Platinum 8180 2.50GHz |
| CPU Characteristics: | 28-Core, 2.50 GHz, 38.5 MB L3 Cache |
| CPU Frequency (MHz): | 2500 |
| CPU(s) Enabled: | 56 cores, 2 chips, 28 cores/chip |
| Hardware Threads: | 112 (2 / core) |
| CPU(s) Orderable: | 1,2 chips |
| Primary Cache: | 32 KB I + 32 KB D on chip per core |
| Secondary Cache: | 1 MB I+D on chip per core |
| Tertiary Cache: | 39424 KB I+D on chip per chip |
| Other Cache: | None |
| Memory Amount (GB): | 192.0 |
| # and size of DIMM: | 12 x 16384 MB |
| Memory Details: | 12 x 16GB 2Rx8 PC4-2666-V ECC;slots A1, A2, A3, A4, A5, A6, B1, B2, B3, B4, B5, B6 populated |
| Power Supply Quantity and Rating (W): | None |
| Power Supply Details: | Shared |
| Disk Drive: | SATA DOM 128GB P/N DESSH-A28D09BCADCA |
| Disk Controller: | Integrated SATA controller |
| # and type of Network Interface Cards (NICs) Installed: | 1 x Intel I350 Gigabit Ethernet Controller |
| NICs Enabled in Firmware / OS / Connected: | 2/2/1 |
| Network Speed (Mbit): | 1000 |
| Keyboard: | None |
| Mouse: | None |
| Monitor: | None |
| Optical Drives: | No |
| Other Hardware: | None |
| Software | |
|---|---|
| Power Management: | Balanced Mode enabled in OS (see SUT Notes) |
| Operating System (OS): | Microsoft Windows Server 2012 R2 Datacenter |
| OS Version: | Version 6.3 (Build 9600) |
| Filesystem: | NTFS |
| JVM Vendor: | Oracle Corporation |
| JVM Version: | Java HotSpot(TM) 64-Bit Server VM (build 24.80-b11, mixed mode), version 1.7.0_80 |
| JVM Command-line Options: | -server -Xmn19g -Xms21g -Xmx21g -XX:SurvivorRatio=1 -XX:TargetSurvivorRatio=99 -XX:ParallelGCThreads=28 -XX:AllocatePrefetchDistance=256 -XX:AllocatePrefetchLines=4 -XX:LoopUnrollLimit=45 -XX:InitialTenuringThreshold=12 -XX:MaxTenuringThreshold=15 -XX:InlineSmallCode=9000 -XX:MaxInlineSize=270 -XX:FreqInlineSize=6000 -XX:+UseLargePages -XX:+UseParallelOldGC -XX:+AggressiveOpts |
| JVM Affinity: | start /NODE [0,2] /AFFINITY [0xFC0FF00FC0FF];start /NODE [1,3] /AFFINITY [0xFF03F00FF03F] |
| JVM Instances: | 4 |
| JVM Initial Heap (MB): | 21000 |
| JVM Maximum Heap (MB): | 21000 |
| JVM Address Bits: | 64 |
| Boot Firmware Version: | 2.00.25 |
| Management Firmware Version: | UIS-OM 1.00.10 |
| Workload Version: | SSJ 1.2.10 |
| Director Location: | Controller |
| Other Software: | Microsoft Windows KB3021910, clearcompressionflag.exe, KB2919355, KB2932046, KB2959977, KB2937592, KB2938439, KB2934018, KB4056898, patched to this test system in May 7,2019 |
| JVM Instance | ssj_ops@100% |
|---|---|
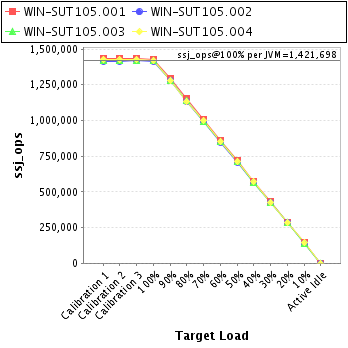
| WIN-SUT105.001 | 1,430,295 |
| WIN-SUT105.002 | 1,415,862 |
| WIN-SUT105.003 | 1,418,141 |
| WIN-SUT105.004 | 1,422,495 |
| ssj_ops@100% | 5,686,793 |
| ssj_ops@100% per JVM | 1,421,698 |
| Target Load | Actual Load | ssj_ops | |
|---|---|---|---|
| Target | Actual | ||
| Calibration 1 | 1,432,435 | ||
| Calibration 2 | 1,433,627 | ||
| Calibration 3 | 1,436,496 | ||
| ssj_ops@calibrated=1,435,062 | |||
| 100% | 99.7% | 1,435,062 | 1,430,295 |
| 90% | 90.1% | 1,291,555 | 1,292,319 |
| 80% | 80.2% | 1,148,049 | 1,150,608 |
| 70% | 70.1% | 1,004,543 | 1,005,874 |
| 60% | 60.0% | 861,037 | 861,685 |
| 50% | 49.9% | 717,531 | 716,681 |
| 40% | 39.8% | 574,025 | 571,747 |
| 30% | 29.9% | 430,518 | 429,298 |
| 20% | 20.0% | 287,012 | 287,485 |
| 10% | 10.0% | 143,506 | 143,520 |
| Active Idle | 0 | 0 | |

| Target Load | Actual Load | ssj_ops | |
|---|---|---|---|
| Target | Actual | ||
| Calibration 1 | 1,414,881 | ||
| Calibration 2 | 1,413,807 | ||
| Calibration 3 | 1,418,407 | ||
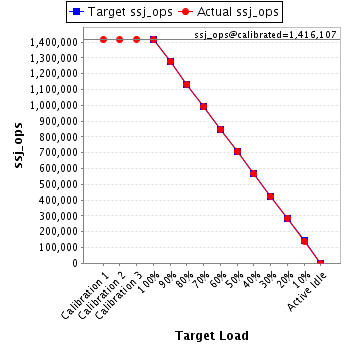
| ssj_ops@calibrated=1,416,107 | |||
| 100% | 100.0% | 1,416,107 | 1,415,862 |
| 90% | 90.2% | 1,274,496 | 1,276,767 |
| 80% | 80.1% | 1,132,886 | 1,133,784 |
| 70% | 69.9% | 991,275 | 990,268 |
| 60% | 59.9% | 849,664 | 847,950 |
| 50% | 50.0% | 708,053 | 708,675 |
| 40% | 39.9% | 566,443 | 565,696 |
| 30% | 29.9% | 424,832 | 423,494 |
| 20% | 20.1% | 283,221 | 284,964 |
| 10% | 9.9% | 141,611 | 140,194 |
| Active Idle | 0 | 0 | |
| Target Load | Actual Load | ssj_ops | |
|---|---|---|---|
| Target | Actual | ||
| Calibration 1 | 1,418,125 | ||
| Calibration 2 | 1,421,851 | ||
| Calibration 3 | 1,418,391 | ||
| ssj_ops@calibrated=1,420,121 | |||
| 100% | 99.9% | 1,420,121 | 1,418,141 |
| 90% | 90.0% | 1,278,109 | 1,278,377 |
| 80% | 80.5% | 1,136,097 | 1,143,159 |
| 70% | 69.9% | 994,085 | 992,354 |
| 60% | 60.1% | 852,073 | 853,855 |
| 50% | 50.1% | 710,061 | 711,180 |
| 40% | 40.1% | 568,048 | 568,766 |
| 30% | 29.9% | 426,036 | 424,155 |
| 20% | 20.0% | 284,024 | 284,399 |
| 10% | 10.0% | 142,012 | 141,612 |
| Active Idle | 0 | 0 | |

| Target Load | Actual Load | ssj_ops | |
|---|---|---|---|
| Target | Actual | ||
| Calibration 1 | 1,428,720 | ||
| Calibration 2 | 1,424,923 | ||
| Calibration 3 | 1,428,185 | ||
| ssj_ops@calibrated=1,426,554 | |||
| 100% | 99.7% | 1,426,554 | 1,422,495 |
| 90% | 89.7% | 1,283,899 | 1,279,773 |
| 80% | 79.6% | 1,141,244 | 1,135,187 |
| 70% | 70.3% | 998,588 | 1,002,972 |
| 60% | 59.7% | 855,933 | 851,809 |
| 50% | 50.1% | 713,277 | 714,700 |
| 40% | 40.0% | 570,622 | 570,885 |
| 30% | 30.1% | 427,966 | 428,719 |
| 20% | 20.0% | 285,311 | 285,292 |
| 10% | 10.0% | 142,655 | 143,285 |
| Active Idle | 0 | 0 | |
