
SPECpower_ssj2008
Host 'WIN-SUT110' Performance Report
Copyright © 2007-2019 Standard Performance Evaluation Corporation
| New H3C Technologies Co., Ltd. H3C UniServer B5700 G3 | ssj_ops@100% = 5,681,740 ssj_ops@100% per JVM = 1,420,435 |
||||
| Test Sponsor: | New H3C Technologies Co., Ltd. | SPEC License #: | 9066 | Test Method: | Multi Node |
| Tested By: | New H3C Technologies Co., Ltd. | Test Location: | Hangzhou, Zhejiang, China | Test Date: | May 14, 2019 |
| Hardware Availability: | Jan-2019 | Software Availability: | Jan-2019 | Publication: | Jun 12, 2019 |
| System Source: | Single Supplier | System Designation: | Server | Power Provisioning: | Line-powered |
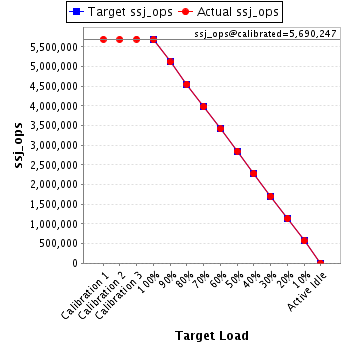
| Target Load | Actual Load | ssj_ops | |
|---|---|---|---|
| Target | Actual | ||
| Calibration 1 | 5,691,237 | ||
| Calibration 2 | 5,685,414 | ||
| Calibration 3 | 5,695,080 | ||
| ssj_ops@calibrated=5,690,247 | |||
| 100% | 99.9% | 5,690,247 | 5,681,740 |
| 90% | 89.9% | 5,121,223 | 5,116,274 |
| 80% | 79.9% | 4,552,198 | 4,549,329 |
| 70% | 69.9% | 3,983,173 | 3,976,593 |
| 60% | 60.0% | 3,414,148 | 3,413,445 |
| 50% | 50.1% | 2,845,124 | 2,848,541 |
| 40% | 40.0% | 2,276,099 | 2,275,212 |
| 30% | 30.0% | 1,707,074 | 1,705,443 |
| 20% | 20.0% | 1,138,049 | 1,138,273 |
| 10% | 10.0% | 569,025 | 568,106 |
| Active Idle | 0 | 0 | |
| Set Identifier: | sut |
| Set Description: | System Under Test |
| # of Identical Nodes: | 11 |
| Comment: | SUT |
| Hardware | |
|---|---|
| Hardware Vendor: | New H3C Technologies Co., Ltd. |
| Model: | H3C UniServer B5700 G3 |
| Form Factor: | Other |
| CPU Name: | Intel Xeon Platinum 8180 2.50GHz |
| CPU Characteristics: | 28-Core, 2.50 GHz, 38.5 MB L3 Cache |
| CPU Frequency (MHz): | 2500 |
| CPU(s) Enabled: | 56 cores, 2 chips, 28 cores/chip |
| Hardware Threads: | 112 (2 / core) |
| CPU(s) Orderable: | 1,2 chips |
| Primary Cache: | 32 KB I + 32 KB D on chip per core |
| Secondary Cache: | 1 MB I+D on chip per core |
| Tertiary Cache: | 39424 KB I+D on chip per chip |
| Other Cache: | None |
| Memory Amount (GB): | 192.0 |
| # and size of DIMM: | 12 x 16384 MB |
| Memory Details: | 12 x 16GB 2Rx8 PC4-2666-V ECC;slots A1, A2, A3, A4, A5, A6, B1, B2, B3, B4, B5, B6 populated |
| Power Supply Quantity and Rating (W): | None |
| Power Supply Details: | Shared |
| Disk Drive: | SATA DOM 128GB P/N DESSH-A28D09BCADCA |
| Disk Controller: | Integrated SATA controller |
| # and type of Network Interface Cards (NICs) Installed: | 1 x Intel I350 Gigabit Ethernet Controller |
| NICs Enabled in Firmware / OS / Connected: | 2/2/1 |
| Network Speed (Mbit): | 1000 |
| Keyboard: | None |
| Mouse: | None |
| Monitor: | None |
| Optical Drives: | No |
| Other Hardware: | None |
| Software | |
|---|---|
| Power Management: | Balanced Mode enabled in OS (see SUT Notes) |
| Operating System (OS): | Microsoft Windows Server 2012 R2 Datacenter |
| OS Version: | Version 6.3 (Build 9600) |
| Filesystem: | NTFS |
| JVM Vendor: | Oracle Corporation |
| JVM Version: | Java HotSpot(TM) 64-Bit Server VM (build 24.80-b11, mixed mode), version 1.7.0_80 |
| JVM Command-line Options: | -server -Xmn19g -Xms21g -Xmx21g -XX:SurvivorRatio=1 -XX:TargetSurvivorRatio=99 -XX:ParallelGCThreads=28 -XX:AllocatePrefetchDistance=256 -XX:AllocatePrefetchLines=4 -XX:LoopUnrollLimit=45 -XX:InitialTenuringThreshold=12 -XX:MaxTenuringThreshold=15 -XX:InlineSmallCode=9000 -XX:MaxInlineSize=270 -XX:FreqInlineSize=6000 -XX:+UseLargePages -XX:+UseParallelOldGC -XX:+AggressiveOpts |
| JVM Affinity: | start /NODE [0,2] /AFFINITY [0xFC0FF00FC0FF];start /NODE [1,3] /AFFINITY [0xFF03F00FF03F] |
| JVM Instances: | 4 |
| JVM Initial Heap (MB): | 21000 |
| JVM Maximum Heap (MB): | 21000 |
| JVM Address Bits: | 64 |
| Boot Firmware Version: | 2.00.25 |
| Management Firmware Version: | UIS-OM 1.00.10 |
| Workload Version: | SSJ 1.2.10 |
| Director Location: | Controller |
| Other Software: | Microsoft Windows KB3021910, clearcompressionflag.exe, KB2919355, KB2932046, KB2959977, KB2937592, KB2938439, KB2934018, KB4056898, patched to this test system in May 7,2019 |
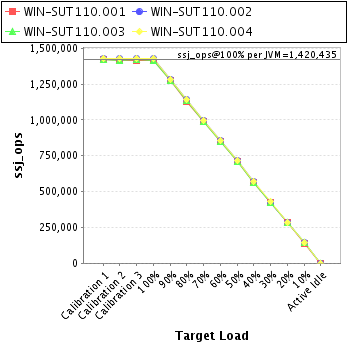
| JVM Instance | ssj_ops@100% |
|---|---|
| WIN-SUT110.001 | 1,414,058 |
| WIN-SUT110.002 | 1,426,976 |
| WIN-SUT110.003 | 1,415,247 |
| WIN-SUT110.004 | 1,425,459 |
| ssj_ops@100% | 5,681,740 |
| ssj_ops@100% per JVM | 1,420,435 |
| Target Load | Actual Load | ssj_ops | |
|---|---|---|---|
| Target | Actual | ||
| Calibration 1 | 1,418,230 | ||
| Calibration 2 | 1,413,979 | ||
| Calibration 3 | 1,416,807 | ||
| ssj_ops@calibrated=1,415,393 | |||
| 100% | 99.9% | 1,415,393 | 1,414,058 |
| 90% | 90.1% | 1,273,854 | 1,275,326 |
| 80% | 79.9% | 1,132,314 | 1,130,398 |
| 70% | 69.9% | 990,775 | 988,694 |
| 60% | 60.1% | 849,236 | 850,909 |
| 50% | 50.0% | 707,697 | 707,243 |
| 40% | 40.0% | 566,157 | 566,080 |
| 30% | 30.1% | 424,618 | 425,399 |
| 20% | 20.0% | 283,079 | 283,661 |
| 10% | 9.9% | 141,539 | 140,662 |
| Active Idle | 0 | 0 | |
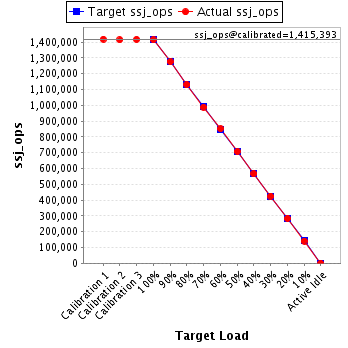
| Target Load | Actual Load | ssj_ops | |
|---|---|---|---|
| Target | Actual | ||
| Calibration 1 | 1,425,481 | ||
| Calibration 2 | 1,426,824 | ||
| Calibration 3 | 1,429,824 | ||
| ssj_ops@calibrated=1,428,324 | |||
| 100% | 99.9% | 1,428,324 | 1,426,976 |
| 90% | 89.9% | 1,285,492 | 1,284,548 |
| 80% | 80.0% | 1,142,660 | 1,143,160 |
| 70% | 69.9% | 999,827 | 998,540 |
| 60% | 60.0% | 856,995 | 856,313 |
| 50% | 50.1% | 714,162 | 715,426 |
| 40% | 40.0% | 571,330 | 571,351 |
| 30% | 29.9% | 428,497 | 427,057 |
| 20% | 19.9% | 285,665 | 284,385 |
| 10% | 10.0% | 142,832 | 143,036 |
| Active Idle | 0 | 0 | |
| Target Load | Actual Load | ssj_ops | |
|---|---|---|---|
| Target | Actual | ||
| Calibration 1 | 1,418,599 | ||
| Calibration 2 | 1,416,995 | ||
| Calibration 3 | 1,417,972 | ||
| ssj_ops@calibrated=1,417,484 | |||
| 100% | 99.8% | 1,417,484 | 1,415,247 |
| 90% | 89.9% | 1,275,735 | 1,273,840 |
| 80% | 80.0% | 1,133,987 | 1,133,737 |
| 70% | 69.9% | 992,239 | 991,291 |
| 60% | 60.1% | 850,490 | 852,429 |
| 50% | 50.1% | 708,742 | 710,538 |
| 40% | 39.9% | 566,994 | 565,929 |
| 30% | 29.9% | 425,245 | 423,745 |
| 20% | 20.0% | 283,497 | 282,996 |
| 10% | 10.0% | 141,748 | 141,493 |
| Active Idle | 0 | 0 | |

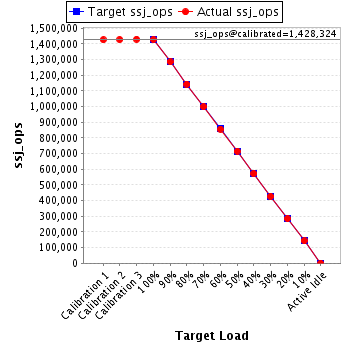
| Target Load | Actual Load | ssj_ops | |
|---|---|---|---|
| Target | Actual | ||
| Calibration 1 | 1,428,927 | ||
| Calibration 2 | 1,427,615 | ||
| Calibration 3 | 1,430,477 | ||
| ssj_ops@calibrated=1,429,046 | |||
| 100% | 99.7% | 1,429,046 | 1,425,459 |
| 90% | 89.7% | 1,286,142 | 1,282,560 |
| 80% | 79.9% | 1,143,237 | 1,142,034 |
| 70% | 69.8% | 1,000,332 | 998,069 |
| 60% | 59.7% | 857,428 | 853,793 |
| 50% | 50.1% | 714,523 | 715,335 |
| 40% | 40.0% | 571,618 | 571,852 |
| 30% | 30.0% | 428,714 | 429,241 |
| 20% | 20.1% | 285,809 | 287,231 |
| 10% | 10.0% | 142,905 | 142,915 |
| Active Idle | 0 | 0 | |
