SPECpower_ssj2008
Host 'WIN-SUT111' Performance Report
Copyright © 2007-2019 Standard Performance Evaluation Corporation
| New H3C Technologies Co., Ltd. H3C UniServer B5700 G3 | ssj_ops@100% = 5,691,324 ssj_ops@100% per JVM = 1,422,831 |
||||
| Test Sponsor: | New H3C Technologies Co., Ltd. | SPEC License #: | 9066 | Test Method: | Multi Node |
| Tested By: | New H3C Technologies Co., Ltd. | Test Location: | Hangzhou, Zhejiang, China | Test Date: | May 14, 2019 |
| Hardware Availability: | Jan-2019 | Software Availability: | Jan-2019 | Publication: | Jun 12, 2019 |
| System Source: | Single Supplier | System Designation: | Server | Power Provisioning: | Line-powered |
| Target Load | Actual Load | ssj_ops | |
|---|---|---|---|
| Target | Actual | ||
| Calibration 1 | 5,698,975 | ||
| Calibration 2 | 5,698,054 | ||
| Calibration 3 | 5,701,368 | ||
| ssj_ops@calibrated=5,699,711 | |||
| 100% | 99.9% | 5,699,711 | 5,691,324 |
| 90% | 90.0% | 5,129,739 | 5,128,283 |
| 80% | 80.0% | 4,559,768 | 4,558,218 |
| 70% | 70.0% | 3,989,797 | 3,991,134 |
| 60% | 60.0% | 3,419,826 | 3,419,827 |
| 50% | 50.1% | 2,849,855 | 2,855,080 |
| 40% | 40.0% | 2,279,884 | 2,279,461 |
| 30% | 29.9% | 1,709,913 | 1,703,894 |
| 20% | 20.0% | 1,139,942 | 1,140,258 |
| 10% | 10.0% | 569,971 | 571,730 |
| Active Idle | 0 | 0 | |

| Set Identifier: | sut |
| Set Description: | System Under Test |
| # of Identical Nodes: | 11 |
| Comment: | SUT |
| Hardware | |
|---|---|
| Hardware Vendor: | New H3C Technologies Co., Ltd. |
| Model: | H3C UniServer B5700 G3 |
| Form Factor: | Other |
| CPU Name: | Intel Xeon Platinum 8180 2.50GHz |
| CPU Characteristics: | 28-Core, 2.50 GHz, 38.5 MB L3 Cache |
| CPU Frequency (MHz): | 2500 |
| CPU(s) Enabled: | 56 cores, 2 chips, 28 cores/chip |
| Hardware Threads: | 112 (2 / core) |
| CPU(s) Orderable: | 1,2 chips |
| Primary Cache: | 32 KB I + 32 KB D on chip per core |
| Secondary Cache: | 1 MB I+D on chip per core |
| Tertiary Cache: | 39424 KB I+D on chip per chip |
| Other Cache: | None |
| Memory Amount (GB): | 192.0 |
| # and size of DIMM: | 12 x 16384 MB |
| Memory Details: | 12 x 16GB 2Rx8 PC4-2666-V ECC;slots A1, A2, A3, A4, A5, A6, B1, B2, B3, B4, B5, B6 populated |
| Power Supply Quantity and Rating (W): | None |
| Power Supply Details: | Shared |
| Disk Drive: | SATA DOM 128GB P/N DESSH-A28D09BCADCA |
| Disk Controller: | Integrated SATA controller |
| # and type of Network Interface Cards (NICs) Installed: | 1 x Intel I350 Gigabit Ethernet Controller |
| NICs Enabled in Firmware / OS / Connected: | 2/2/1 |
| Network Speed (Mbit): | 1000 |
| Keyboard: | None |
| Mouse: | None |
| Monitor: | None |
| Optical Drives: | No |
| Other Hardware: | None |
| Software | |
|---|---|
| Power Management: | Balanced Mode enabled in OS (see SUT Notes) |
| Operating System (OS): | Microsoft Windows Server 2012 R2 Datacenter |
| OS Version: | Version 6.3 (Build 9600) |
| Filesystem: | NTFS |
| JVM Vendor: | Oracle Corporation |
| JVM Version: | Java HotSpot(TM) 64-Bit Server VM (build 24.80-b11, mixed mode), version 1.7.0_80 |
| JVM Command-line Options: | -server -Xmn19g -Xms21g -Xmx21g -XX:SurvivorRatio=1 -XX:TargetSurvivorRatio=99 -XX:ParallelGCThreads=28 -XX:AllocatePrefetchDistance=256 -XX:AllocatePrefetchLines=4 -XX:LoopUnrollLimit=45 -XX:InitialTenuringThreshold=12 -XX:MaxTenuringThreshold=15 -XX:InlineSmallCode=9000 -XX:MaxInlineSize=270 -XX:FreqInlineSize=6000 -XX:+UseLargePages -XX:+UseParallelOldGC -XX:+AggressiveOpts |
| JVM Affinity: | start /NODE [0,2] /AFFINITY [0xFC0FF00FC0FF];start /NODE [1,3] /AFFINITY [0xFF03F00FF03F] |
| JVM Instances: | 4 |
| JVM Initial Heap (MB): | 21000 |
| JVM Maximum Heap (MB): | 21000 |
| JVM Address Bits: | 64 |
| Boot Firmware Version: | 2.00.25 |
| Management Firmware Version: | UIS-OM 1.00.10 |
| Workload Version: | SSJ 1.2.10 |
| Director Location: | Controller |
| Other Software: | Microsoft Windows KB3021910, clearcompressionflag.exe, KB2919355, KB2932046, KB2959977, KB2937592, KB2938439, KB2934018, KB4056898, patched to this test system in May 7,2019 |
| JVM Instance | ssj_ops@100% |
|---|---|
| WIN-SUT111.001 | 1,418,861 |
| WIN-SUT111.002 | 1,425,333 |
| WIN-SUT111.003 | 1,427,400 |
| WIN-SUT111.004 | 1,419,730 |
| ssj_ops@100% | 5,691,324 |
| ssj_ops@100% per JVM | 1,422,831 |

| Target Load | Actual Load | ssj_ops | |
|---|---|---|---|
| Target | Actual | ||
| Calibration 1 | 1,423,450 | ||
| Calibration 2 | 1,421,926 | ||
| Calibration 3 | 1,425,785 | ||
| ssj_ops@calibrated=1,423,856 | |||
| 100% | 99.6% | 1,423,856 | 1,418,861 |
| 90% | 90.0% | 1,281,470 | 1,281,654 |
| 80% | 79.9% | 1,139,085 | 1,137,852 |
| 70% | 70.0% | 996,699 | 996,752 |
| 60% | 60.2% | 854,313 | 856,634 |
| 50% | 50.0% | 711,928 | 711,658 |
| 40% | 39.8% | 569,542 | 567,066 |
| 30% | 30.0% | 427,157 | 426,505 |
| 20% | 20.0% | 284,771 | 284,819 |
| 10% | 10.1% | 142,386 | 143,170 |
| Active Idle | 0 | 0 | |

| Target Load | Actual Load | ssj_ops | |
|---|---|---|---|
| Target | Actual | ||
| Calibration 1 | 1,427,790 | ||
| Calibration 2 | 1,426,633 | ||
| Calibration 3 | 1,426,501 | ||
| ssj_ops@calibrated=1,426,567 | |||
| 100% | 99.9% | 1,426,567 | 1,425,333 |
| 90% | 90.1% | 1,283,910 | 1,284,658 |
| 80% | 79.9% | 1,141,253 | 1,139,296 |
| 70% | 70.0% | 998,597 | 999,273 |
| 60% | 59.9% | 855,940 | 854,046 |
| 50% | 50.2% | 713,283 | 715,531 |
| 40% | 39.9% | 570,627 | 569,224 |
| 30% | 29.9% | 427,970 | 425,936 |
| 20% | 20.0% | 285,313 | 285,702 |
| 10% | 10.0% | 142,657 | 143,147 |
| Active Idle | 0 | 0 | |

| Target Load | Actual Load | ssj_ops | |
|---|---|---|---|
| Target | Actual | ||
| Calibration 1 | 1,428,885 | ||
| Calibration 2 | 1,429,242 | ||
| Calibration 3 | 1,428,788 | ||
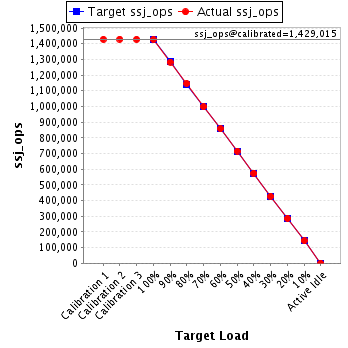
| ssj_ops@calibrated=1,429,015 | |||
| 100% | 99.9% | 1,429,015 | 1,427,400 |
| 90% | 89.8% | 1,286,113 | 1,283,601 |
| 80% | 80.3% | 1,143,212 | 1,146,954 |
| 70% | 69.9% | 1,000,310 | 998,343 |
| 60% | 60.0% | 857,409 | 857,558 |
| 50% | 50.1% | 714,507 | 715,884 |
| 40% | 40.2% | 571,606 | 573,975 |
| 30% | 29.9% | 428,704 | 427,022 |
| 20% | 20.0% | 285,803 | 285,918 |
| 10% | 10.0% | 142,901 | 143,443 |
| Active Idle | 0 | 0 | |
| Target Load | Actual Load | ssj_ops | |
|---|---|---|---|
| Target | Actual | ||
| Calibration 1 | 1,418,850 | ||
| Calibration 2 | 1,420,253 | ||
| Calibration 3 | 1,420,294 | ||
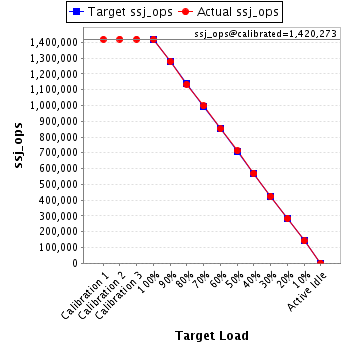
| ssj_ops@calibrated=1,420,273 | |||
| 100% | 100.0% | 1,420,273 | 1,419,730 |
| 90% | 90.0% | 1,278,246 | 1,278,370 |
| 80% | 79.9% | 1,136,219 | 1,134,116 |
| 70% | 70.2% | 994,191 | 996,766 |
| 60% | 60.0% | 852,164 | 851,589 |
| 50% | 50.1% | 710,137 | 712,006 |
| 40% | 40.1% | 568,109 | 569,195 |
| 30% | 29.9% | 426,082 | 424,432 |
| 20% | 20.0% | 284,055 | 283,819 |
| 10% | 10.0% | 142,027 | 141,969 |
| Active Idle | 0 | 0 | |