SPECpower_ssj2008
Host 'WIN-SUT101' Performance Report
Copyright © 2007-2019 Standard Performance Evaluation Corporation
| New H3C Technologies Co., Ltd. H3C UniServer B5700 G3 | ssj_ops@100% = 5,673,072 ssj_ops@100% per JVM = 1,418,268 |
||||
| Test Sponsor: | New H3C Technologies Co., Ltd. | SPEC License #: | 9066 | Test Method: | Multi Node |
| Tested By: | New H3C Technologies Co., Ltd. | Test Location: | Hangzhou, Zhejiang, China | Test Date: | May 13, 2019 |
| Hardware Availability: | Jan-2019 | Software Availability: | Jan-2019 | Publication: | Jun 12, 2019 |
| System Source: | Single Supplier | System Designation: | Server | Power Provisioning: | Line-powered |
| Target Load | Actual Load | ssj_ops | |
|---|---|---|---|
| Target | Actual | ||
| Calibration 1 | 5,681,157 | ||
| Calibration 2 | 5,679,052 | ||
| Calibration 3 | 5,689,892 | ||
| ssj_ops@calibrated=5,684,472 | |||
| 100% | 99.8% | 5,684,472 | 5,673,072 |
| 90% | 90.0% | 5,116,025 | 5,114,587 |
| 80% | 80.0% | 4,547,577 | 4,548,945 |
| 70% | 70.0% | 3,979,130 | 3,980,834 |
| 60% | 60.1% | 3,410,683 | 3,415,669 |
| 50% | 50.0% | 2,842,236 | 2,845,046 |
| 40% | 40.1% | 2,273,789 | 2,277,361 |
| 30% | 30.0% | 1,705,342 | 1,707,296 |
| 20% | 19.9% | 1,136,894 | 1,133,925 |
| 10% | 10.0% | 568,447 | 568,625 |
| Active Idle | 0 | 0 | |

| Set Identifier: | sut |
| Set Description: | System Under Test |
| # of Identical Nodes: | 12 |
| Comment: | SUT |
| Hardware | |
|---|---|
| Hardware Vendor: | New H3C Technologies Co., Ltd. |
| Model: | H3C UniServer B5700 G3 |
| Form Factor: | Other |
| CPU Name: | Intel Xeon Platinum 8180 2.50GHz |
| CPU Characteristics: | 28-Core, 2.50 GHz, 38.5 MB L3 Cache |
| CPU Frequency (MHz): | 2500 |
| CPU(s) Enabled: | 56 cores, 2 chips, 28 cores/chip |
| Hardware Threads: | 112 (2 / core) |
| CPU(s) Orderable: | 1,2 chips |
| Primary Cache: | 32 KB I + 32 KB D on chip per core |
| Secondary Cache: | 1 MB I+D on chip per core |
| Tertiary Cache: | 39424 KB I+D on chip per chip |
| Other Cache: | None |
| Memory Amount (GB): | 192.0 |
| # and size of DIMM: | 12 x 16384 MB |
| Memory Details: | 12 x 16GB 2Rx8 PC4-2666-V ECC;slots A1, A2, A3, A4, A5, A6, B1, B2, B3, B4, B5, B6 populated |
| Power Supply Quantity and Rating (W): | None |
| Power Supply Details: | Shared |
| Disk Drive: | SATA DOM 128GB P/N DESSH-A28D09BCADCA |
| Disk Controller: | Integrated SATA controller |
| # and type of Network Interface Cards (NICs) Installed: | 1 x Intel I350 Gigabit Ethernet Controller |
| NICs Enabled in Firmware / OS / Connected: | 2/2/1 |
| Network Speed (Mbit): | 1000 |
| Keyboard: | None |
| Mouse: | None |
| Monitor: | None |
| Optical Drives: | No |
| Other Hardware: | None |
| Software | |
|---|---|
| Power Management: | Balanced Mode enabled in OS (see SUT Notes) |
| Operating System (OS): | Microsoft Windows Server 2012 R2 Datacenter |
| OS Version: | Version 6.3 (Build 9600) |
| Filesystem: | NTFS |
| JVM Vendor: | Oracle Corporation |
| JVM Version: | Java HotSpot(TM) 64-Bit Server VM (build 24.80-b11, mixed mode), version 1.7.0_80 |
| JVM Command-line Options: | -server -Xmn19g -Xms21g -Xmx21g -XX:SurvivorRatio=1 -XX:TargetSurvivorRatio=99 -XX:ParallelGCThreads=28 -XX:AllocatePrefetchDistance=256 -XX:AllocatePrefetchLines=4 -XX:LoopUnrollLimit=45 -XX:InitialTenuringThreshold=12 -XX:MaxTenuringThreshold=15 -XX:InlineSmallCode=9000 -XX:MaxInlineSize=270 -XX:FreqInlineSize=6000 -XX:+UseLargePages -XX:+UseParallelOldGC -XX:+AggressiveOpts |
| JVM Affinity: | start /NODE [0,2] /AFFINITY [0xFC0FF00FC0FF];start /NODE [1,3] /AFFINITY [0xFF03F00FF03F] |
| JVM Instances: | 4 |
| JVM Initial Heap (MB): | 21000 |
| JVM Maximum Heap (MB): | 21000 |
| JVM Address Bits: | 64 |
| Boot Firmware Version: | 2.00.25 |
| Management Firmware Version: | UIS-OM 1.00.10 |
| Workload Version: | SSJ 1.2.10 |
| Director Location: | Controller |
| Other Software: | Microsoft Windows KB3021910, clearcompressionflag.exe, KB2919355, KB2932046, KB2959977, KB2937592, KB2938439, KB2934018, KB4056898, patched to this test system in May 8, 2019 |
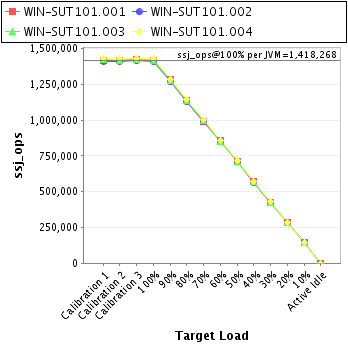
| JVM Instance | ssj_ops@100% |
|---|---|
| WIN-SUT101.001 | 1,418,544 |
| WIN-SUT101.002 | 1,410,149 |
| WIN-SUT101.003 | 1,417,244 |
| WIN-SUT101.004 | 1,427,135 |
| ssj_ops@100% | 5,673,072 |
| ssj_ops@100% per JVM | 1,418,268 |
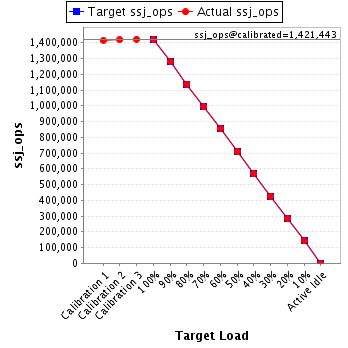
| Target Load | Actual Load | ssj_ops | |
|---|---|---|---|
| Target | Actual | ||
| Calibration 1 | 1,416,469 | ||
| Calibration 2 | 1,419,717 | ||
| Calibration 3 | 1,423,169 | ||
| ssj_ops@calibrated=1,421,443 | |||
| 100% | 99.8% | 1,421,443 | 1,418,544 |
| 90% | 90.2% | 1,279,299 | 1,281,721 |
| 80% | 80.1% | 1,137,155 | 1,138,145 |
| 70% | 69.8% | 995,010 | 992,486 |
| 60% | 60.1% | 852,866 | 854,229 |
| 50% | 50.1% | 710,722 | 711,952 |
| 40% | 40.0% | 568,577 | 568,921 |
| 30% | 30.0% | 426,433 | 426,826 |
| 20% | 20.0% | 284,289 | 283,894 |
| 10% | 10.0% | 142,144 | 142,247 |
| Active Idle | 0 | 0 | |
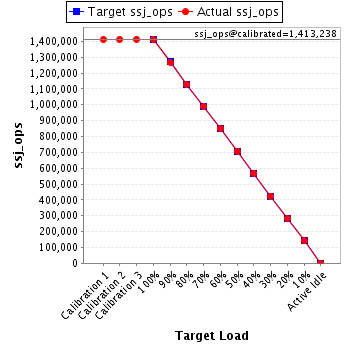
| Target Load | Actual Load | ssj_ops | |
|---|---|---|---|
| Target | Actual | ||
| Calibration 1 | 1,411,720 | ||
| Calibration 2 | 1,412,552 | ||
| Calibration 3 | 1,413,924 | ||
| ssj_ops@calibrated=1,413,238 | |||
| 100% | 99.8% | 1,413,238 | 1,410,149 |
| 90% | 89.8% | 1,271,914 | 1,268,508 |
| 80% | 79.9% | 1,130,590 | 1,129,118 |
| 70% | 70.0% | 989,267 | 989,234 |
| 60% | 60.2% | 847,943 | 851,387 |
| 50% | 50.1% | 706,619 | 708,214 |
| 40% | 40.1% | 565,295 | 566,972 |
| 30% | 30.0% | 423,971 | 423,873 |
| 20% | 19.9% | 282,648 | 281,867 |
| 10% | 10.0% | 141,324 | 141,562 |
| Active Idle | 0 | 0 | |
| Target Load | Actual Load | ssj_ops | |
|---|---|---|---|
| Target | Actual | ||
| Calibration 1 | 1,421,401 | ||
| Calibration 2 | 1,418,851 | ||
| Calibration 3 | 1,420,296 | ||
| ssj_ops@calibrated=1,419,573 | |||
| 100% | 99.8% | 1,419,573 | 1,417,244 |
| 90% | 90.0% | 1,277,616 | 1,277,649 |
| 80% | 80.1% | 1,135,659 | 1,137,037 |
| 70% | 70.2% | 993,701 | 997,118 |
| 60% | 60.0% | 851,744 | 851,688 |
| 50% | 49.9% | 709,787 | 707,878 |
| 40% | 40.1% | 567,829 | 569,656 |
| 30% | 30.1% | 425,872 | 427,726 |
| 20% | 20.0% | 283,915 | 283,436 |
| 10% | 10.0% | 141,957 | 142,540 |
| Active Idle | 0 | 0 | |

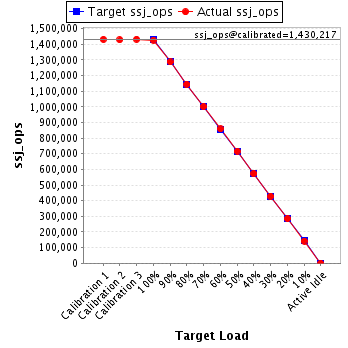
| Target Load | Actual Load | ssj_ops | |
|---|---|---|---|
| Target | Actual | ||
| Calibration 1 | 1,431,567 | ||
| Calibration 2 | 1,427,932 | ||
| Calibration 3 | 1,432,503 | ||
| ssj_ops@calibrated=1,430,217 | |||
| 100% | 99.8% | 1,430,217 | 1,427,135 |
| 90% | 90.0% | 1,287,195 | 1,286,710 |
| 80% | 80.0% | 1,144,174 | 1,144,644 |
| 70% | 70.1% | 1,001,152 | 1,001,995 |
| 60% | 60.0% | 858,130 | 858,365 |
| 50% | 50.1% | 715,109 | 717,001 |
| 40% | 40.0% | 572,087 | 571,812 |
| 30% | 30.0% | 429,065 | 428,871 |
| 20% | 19.9% | 286,043 | 284,728 |
| 10% | 9.9% | 143,022 | 142,277 |
| Active Idle | 0 | 0 | |