SPECpower_ssj2008
Host 'WIN-SUT104' Performance Report
Copyright © 2007-2019 Standard Performance Evaluation Corporation
| New H3C Technologies Co., Ltd. H3C UniServer B5700 G3 | ssj_ops@100% = 5,693,620 ssj_ops@100% per JVM = 1,423,405 |
||||
| Test Sponsor: | New H3C Technologies Co., Ltd. | SPEC License #: | 9066 | Test Method: | Multi Node |
| Tested By: | New H3C Technologies Co., Ltd. | Test Location: | Hangzhou, Zhejiang, China | Test Date: | May 13, 2019 |
| Hardware Availability: | Jan-2019 | Software Availability: | Jan-2019 | Publication: | Jun 12, 2019 |
| System Source: | Single Supplier | System Designation: | Server | Power Provisioning: | Line-powered |
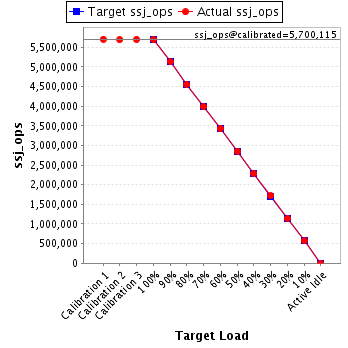
| Target Load | Actual Load | ssj_ops | |
|---|---|---|---|
| Target | Actual | ||
| Calibration 1 | 5,707,419 | ||
| Calibration 2 | 5,693,646 | ||
| Calibration 3 | 5,706,584 | ||
| ssj_ops@calibrated=5,700,115 | |||
| 100% | 99.9% | 5,700,115 | 5,693,620 |
| 90% | 90.0% | 5,130,104 | 5,131,500 |
| 80% | 79.9% | 4,560,092 | 4,554,885 |
| 70% | 70.1% | 3,990,081 | 3,993,729 |
| 60% | 60.1% | 3,420,069 | 3,424,683 |
| 50% | 50.0% | 2,850,058 | 2,851,703 |
| 40% | 40.1% | 2,280,046 | 2,284,491 |
| 30% | 30.1% | 1,710,035 | 1,715,997 |
| 20% | 20.1% | 1,140,023 | 1,142,953 |
| 10% | 10.0% | 570,012 | 570,322 |
| Active Idle | 0 | 0 | |
| Set Identifier: | sut |
| Set Description: | System Under Test |
| # of Identical Nodes: | 12 |
| Comment: | SUT |
| Hardware | |
|---|---|
| Hardware Vendor: | New H3C Technologies Co., Ltd. |
| Model: | H3C UniServer B5700 G3 |
| Form Factor: | Other |
| CPU Name: | Intel Xeon Platinum 8180 2.50GHz |
| CPU Characteristics: | 28-Core, 2.50 GHz, 38.5 MB L3 Cache |
| CPU Frequency (MHz): | 2500 |
| CPU(s) Enabled: | 56 cores, 2 chips, 28 cores/chip |
| Hardware Threads: | 112 (2 / core) |
| CPU(s) Orderable: | 1,2 chips |
| Primary Cache: | 32 KB I + 32 KB D on chip per core |
| Secondary Cache: | 1 MB I+D on chip per core |
| Tertiary Cache: | 39424 KB I+D on chip per chip |
| Other Cache: | None |
| Memory Amount (GB): | 192.0 |
| # and size of DIMM: | 12 x 16384 MB |
| Memory Details: | 12 x 16GB 2Rx8 PC4-2666-V ECC;slots A1, A2, A3, A4, A5, A6, B1, B2, B3, B4, B5, B6 populated |
| Power Supply Quantity and Rating (W): | None |
| Power Supply Details: | Shared |
| Disk Drive: | SATA DOM 128GB P/N DESSH-A28D09BCADCA |
| Disk Controller: | Integrated SATA controller |
| # and type of Network Interface Cards (NICs) Installed: | 1 x Intel I350 Gigabit Ethernet Controller |
| NICs Enabled in Firmware / OS / Connected: | 2/2/1 |
| Network Speed (Mbit): | 1000 |
| Keyboard: | None |
| Mouse: | None |
| Monitor: | None |
| Optical Drives: | No |
| Other Hardware: | None |
| Software | |
|---|---|
| Power Management: | Balanced Mode enabled in OS (see SUT Notes) |
| Operating System (OS): | Microsoft Windows Server 2012 R2 Datacenter |
| OS Version: | Version 6.3 (Build 9600) |
| Filesystem: | NTFS |
| JVM Vendor: | Oracle Corporation |
| JVM Version: | Java HotSpot(TM) 64-Bit Server VM (build 24.80-b11, mixed mode), version 1.7.0_80 |
| JVM Command-line Options: | -server -Xmn19g -Xms21g -Xmx21g -XX:SurvivorRatio=1 -XX:TargetSurvivorRatio=99 -XX:ParallelGCThreads=28 -XX:AllocatePrefetchDistance=256 -XX:AllocatePrefetchLines=4 -XX:LoopUnrollLimit=45 -XX:InitialTenuringThreshold=12 -XX:MaxTenuringThreshold=15 -XX:InlineSmallCode=9000 -XX:MaxInlineSize=270 -XX:FreqInlineSize=6000 -XX:+UseLargePages -XX:+UseParallelOldGC -XX:+AggressiveOpts |
| JVM Affinity: | start /NODE [0,2] /AFFINITY [0xFC0FF00FC0FF];start /NODE [1,3] /AFFINITY [0xFF03F00FF03F] |
| JVM Instances: | 4 |
| JVM Initial Heap (MB): | 21000 |
| JVM Maximum Heap (MB): | 21000 |
| JVM Address Bits: | 64 |
| Boot Firmware Version: | 2.00.25 |
| Management Firmware Version: | UIS-OM 1.00.10 |
| Workload Version: | SSJ 1.2.10 |
| Director Location: | Controller |
| Other Software: | Microsoft Windows KB3021910, clearcompressionflag.exe, KB2919355, KB2932046, KB2959977, KB2937592, KB2938439, KB2934018, KB4056898, patched to this test system in May 8, 2019 |
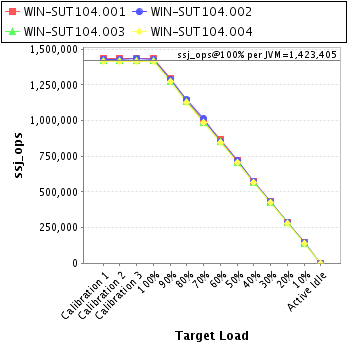
| JVM Instance | ssj_ops@100% |
|---|---|
| WIN-SUT104.001 | 1,434,178 |
| WIN-SUT104.002 | 1,427,956 |
| WIN-SUT104.003 | 1,419,488 |
| WIN-SUT104.004 | 1,411,997 |
| ssj_ops@100% | 5,693,620 |
| ssj_ops@100% per JVM | 1,423,405 |
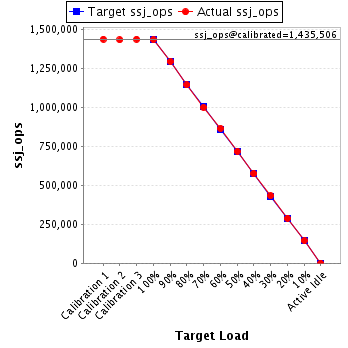
| Target Load | Actual Load | ssj_ops | |
|---|---|---|---|
| Target | Actual | ||
| Calibration 1 | 1,437,893 | ||
| Calibration 2 | 1,433,096 | ||
| Calibration 3 | 1,437,916 | ||
| ssj_ops@calibrated=1,435,506 | |||
| 100% | 99.9% | 1,435,506 | 1,434,178 |
| 90% | 90.2% | 1,291,955 | 1,294,326 |
| 80% | 79.7% | 1,148,404 | 1,144,249 |
| 70% | 69.7% | 1,004,854 | 1,001,052 |
| 60% | 60.3% | 861,303 | 865,364 |
| 50% | 50.0% | 717,753 | 717,931 |
| 40% | 40.1% | 574,202 | 574,965 |
| 30% | 30.1% | 430,652 | 431,999 |
| 20% | 20.1% | 287,101 | 289,015 |
| 10% | 10.1% | 143,551 | 145,055 |
| Active Idle | 0 | 0 | |
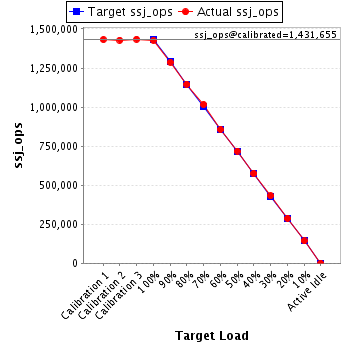
| Target Load | Actual Load | ssj_ops | |
|---|---|---|---|
| Target | Actual | ||
| Calibration 1 | 1,432,078 | ||
| Calibration 2 | 1,428,688 | ||
| Calibration 3 | 1,434,622 | ||
| ssj_ops@calibrated=1,431,655 | |||
| 100% | 99.7% | 1,431,655 | 1,427,956 |
| 90% | 89.9% | 1,288,489 | 1,287,158 |
| 80% | 80.0% | 1,145,324 | 1,145,741 |
| 70% | 71.0% | 1,002,158 | 1,016,523 |
| 60% | 59.9% | 858,993 | 857,060 |
| 50% | 50.2% | 715,827 | 718,425 |
| 40% | 40.1% | 572,662 | 574,356 |
| 30% | 30.1% | 429,496 | 431,077 |
| 20% | 20.1% | 286,331 | 288,334 |
| 10% | 10.0% | 143,165 | 142,973 |
| Active Idle | 0 | 0 | |
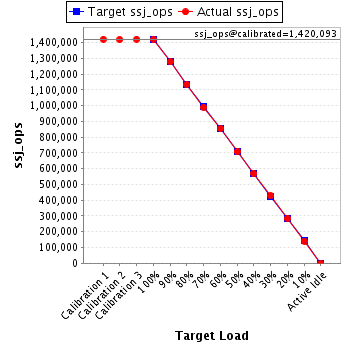
| Target Load | Actual Load | ssj_ops | |
|---|---|---|---|
| Target | Actual | ||
| Calibration 1 | 1,421,185 | ||
| Calibration 2 | 1,418,625 | ||
| Calibration 3 | 1,421,561 | ||
| ssj_ops@calibrated=1,420,093 | |||
| 100% | 100.0% | 1,420,093 | 1,419,488 |
| 90% | 90.0% | 1,278,084 | 1,277,616 |
| 80% | 79.9% | 1,136,075 | 1,134,994 |
| 70% | 69.7% | 994,065 | 989,770 |
| 60% | 60.1% | 852,056 | 854,183 |
| 50% | 49.9% | 710,047 | 708,242 |
| 40% | 40.0% | 568,037 | 568,176 |
| 30% | 30.1% | 426,028 | 426,951 |
| 20% | 20.0% | 284,019 | 283,833 |
| 10% | 9.9% | 142,009 | 141,133 |
| Active Idle | 0 | 0 | |
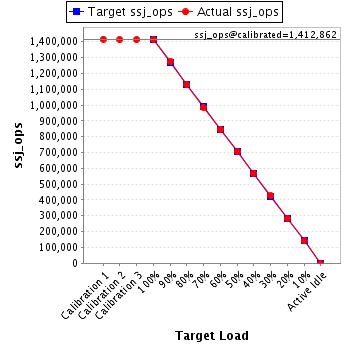
| Target Load | Actual Load | ssj_ops | |
|---|---|---|---|
| Target | Actual | ||
| Calibration 1 | 1,416,264 | ||
| Calibration 2 | 1,413,237 | ||
| Calibration 3 | 1,412,486 | ||
| ssj_ops@calibrated=1,412,862 | |||
| 100% | 99.9% | 1,412,862 | 1,411,997 |
| 90% | 90.1% | 1,271,575 | 1,272,400 |
| 80% | 80.0% | 1,130,289 | 1,129,901 |
| 70% | 69.8% | 989,003 | 986,383 |
| 60% | 60.0% | 847,717 | 848,075 |
| 50% | 50.0% | 706,431 | 707,105 |
| 40% | 40.1% | 565,145 | 566,994 |
| 30% | 30.1% | 423,858 | 425,970 |
| 20% | 19.9% | 282,572 | 281,771 |
| 10% | 10.0% | 141,286 | 141,160 |
| Active Idle | 0 | 0 | |