
SPECpower_ssj2008
Host 'WIN-SUT105' Performance Report
Copyright © 2007-2019 Standard Performance Evaluation Corporation
| New H3C Technologies Co., Ltd. H3C UniServer B5700 G3 | ssj_ops@100% = 5,693,212 ssj_ops@100% per JVM = 1,423,303 |
||||
| Test Sponsor: | New H3C Technologies Co., Ltd. | SPEC License #: | 9066 | Test Method: | Multi Node |
| Tested By: | New H3C Technologies Co., Ltd. | Test Location: | Hangzhou, Zhejiang, China | Test Date: | May 13, 2019 |
| Hardware Availability: | Jan-2019 | Software Availability: | Jan-2019 | Publication: | Jun 12, 2019 |
| System Source: | Single Supplier | System Designation: | Server | Power Provisioning: | Line-powered |
| Target Load | Actual Load | ssj_ops | |
|---|---|---|---|
| Target | Actual | ||
| Calibration 1 | 5,700,734 | ||
| Calibration 2 | 5,694,893 | ||
| Calibration 3 | 5,707,346 | ||
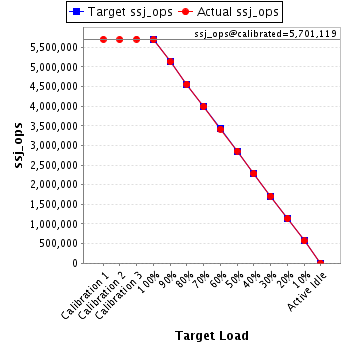
| ssj_ops@calibrated=5,701,119 | |||
| 100% | 99.9% | 5,701,119 | 5,693,212 |
| 90% | 90.0% | 5,131,007 | 5,132,120 |
| 80% | 79.9% | 4,560,896 | 4,557,702 |
| 70% | 70.0% | 3,990,784 | 3,992,520 |
| 60% | 60.0% | 3,420,672 | 3,419,252 |
| 50% | 50.1% | 2,850,560 | 2,858,636 |
| 40% | 40.0% | 2,280,448 | 2,280,305 |
| 30% | 30.0% | 1,710,336 | 1,711,492 |
| 20% | 20.0% | 1,140,224 | 1,140,010 |
| 10% | 10.0% | 570,112 | 569,233 |
| Active Idle | 0 | 0 | |
| Set Identifier: | sut |
| Set Description: | System Under Test |
| # of Identical Nodes: | 12 |
| Comment: | SUT |
| Hardware | |
|---|---|
| Hardware Vendor: | New H3C Technologies Co., Ltd. |
| Model: | H3C UniServer B5700 G3 |
| Form Factor: | Other |
| CPU Name: | Intel Xeon Platinum 8180 2.50GHz |
| CPU Characteristics: | 28-Core, 2.50 GHz, 38.5 MB L3 Cache |
| CPU Frequency (MHz): | 2500 |
| CPU(s) Enabled: | 56 cores, 2 chips, 28 cores/chip |
| Hardware Threads: | 112 (2 / core) |
| CPU(s) Orderable: | 1,2 chips |
| Primary Cache: | 32 KB I + 32 KB D on chip per core |
| Secondary Cache: | 1 MB I+D on chip per core |
| Tertiary Cache: | 39424 KB I+D on chip per chip |
| Other Cache: | None |
| Memory Amount (GB): | 192.0 |
| # and size of DIMM: | 12 x 16384 MB |
| Memory Details: | 12 x 16GB 2Rx8 PC4-2666-V ECC;slots A1, A2, A3, A4, A5, A6, B1, B2, B3, B4, B5, B6 populated |
| Power Supply Quantity and Rating (W): | None |
| Power Supply Details: | Shared |
| Disk Drive: | SATA DOM 128GB P/N DESSH-A28D09BCADCA |
| Disk Controller: | Integrated SATA controller |
| # and type of Network Interface Cards (NICs) Installed: | 1 x Intel I350 Gigabit Ethernet Controller |
| NICs Enabled in Firmware / OS / Connected: | 2/2/1 |
| Network Speed (Mbit): | 1000 |
| Keyboard: | None |
| Mouse: | None |
| Monitor: | None |
| Optical Drives: | No |
| Other Hardware: | None |
| Software | |
|---|---|
| Power Management: | Balanced Mode enabled in OS (see SUT Notes) |
| Operating System (OS): | Microsoft Windows Server 2012 R2 Datacenter |
| OS Version: | Version 6.3 (Build 9600) |
| Filesystem: | NTFS |
| JVM Vendor: | Oracle Corporation |
| JVM Version: | Java HotSpot(TM) 64-Bit Server VM (build 24.80-b11, mixed mode), version 1.7.0_80 |
| JVM Command-line Options: | -server -Xmn19g -Xms21g -Xmx21g -XX:SurvivorRatio=1 -XX:TargetSurvivorRatio=99 -XX:ParallelGCThreads=28 -XX:AllocatePrefetchDistance=256 -XX:AllocatePrefetchLines=4 -XX:LoopUnrollLimit=45 -XX:InitialTenuringThreshold=12 -XX:MaxTenuringThreshold=15 -XX:InlineSmallCode=9000 -XX:MaxInlineSize=270 -XX:FreqInlineSize=6000 -XX:+UseLargePages -XX:+UseParallelOldGC -XX:+AggressiveOpts |
| JVM Affinity: | start /NODE [0,2] /AFFINITY [0xFC0FF00FC0FF];start /NODE [1,3] /AFFINITY [0xFF03F00FF03F] |
| JVM Instances: | 4 |
| JVM Initial Heap (MB): | 21000 |
| JVM Maximum Heap (MB): | 21000 |
| JVM Address Bits: | 64 |
| Boot Firmware Version: | 2.00.25 |
| Management Firmware Version: | UIS-OM 1.00.10 |
| Workload Version: | SSJ 1.2.10 |
| Director Location: | Controller |
| Other Software: | Microsoft Windows KB3021910, clearcompressionflag.exe, KB2919355, KB2932046, KB2959977, KB2937592, KB2938439, KB2934018, KB4056898, patched to this test system in May 8, 2019 |
| JVM Instance | ssj_ops@100% |
|---|---|
| WIN-SUT105.001 | 1,423,224 |
| WIN-SUT105.002 | 1,431,223 |
| WIN-SUT105.003 | 1,418,677 |
| WIN-SUT105.004 | 1,420,088 |
| ssj_ops@100% | 5,693,212 |
| ssj_ops@100% per JVM | 1,423,303 |

| Target Load | Actual Load | ssj_ops | |
|---|---|---|---|
| Target | Actual | ||
| Calibration 1 | 1,425,847 | ||
| Calibration 2 | 1,422,655 | ||
| Calibration 3 | 1,427,939 | ||
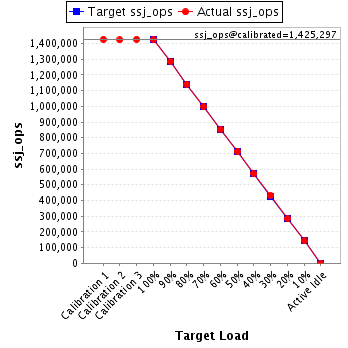
| ssj_ops@calibrated=1,425,297 | |||
| 100% | 99.9% | 1,425,297 | 1,423,224 |
| 90% | 90.2% | 1,282,768 | 1,285,756 |
| 80% | 80.0% | 1,140,238 | 1,140,919 |
| 70% | 70.0% | 997,708 | 997,575 |
| 60% | 59.9% | 855,178 | 853,935 |
| 50% | 50.0% | 712,649 | 712,308 |
| 40% | 40.0% | 570,119 | 570,660 |
| 30% | 30.1% | 427,589 | 429,388 |
| 20% | 20.0% | 285,059 | 285,299 |
| 10% | 10.0% | 142,530 | 143,034 |
| Active Idle | 0 | 0 | |
| Target Load | Actual Load | ssj_ops | |
|---|---|---|---|
| Target | Actual | ||
| Calibration 1 | 1,433,303 | ||
| Calibration 2 | 1,432,648 | ||
| Calibration 3 | 1,434,218 | ||
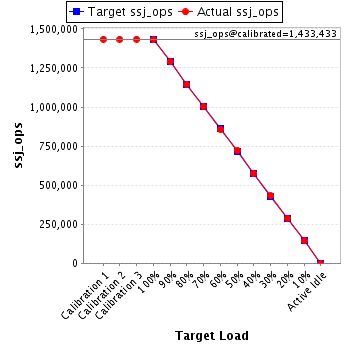
| ssj_ops@calibrated=1,433,433 | |||
| 100% | 99.8% | 1,433,433 | 1,431,223 |
| 90% | 90.0% | 1,290,089 | 1,290,145 |
| 80% | 79.8% | 1,146,746 | 1,144,499 |
| 70% | 69.9% | 1,003,403 | 1,002,547 |
| 60% | 59.9% | 860,060 | 858,759 |
| 50% | 50.3% | 716,716 | 720,327 |
| 40% | 39.9% | 573,373 | 572,592 |
| 30% | 30.1% | 430,030 | 430,891 |
| 20% | 20.1% | 286,687 | 287,777 |
| 10% | 10.0% | 143,343 | 143,159 |
| Active Idle | 0 | 0 | |
| Target Load | Actual Load | ssj_ops | |
|---|---|---|---|
| Target | Actual | ||
| Calibration 1 | 1,420,652 | ||
| Calibration 2 | 1,419,471 | ||
| Calibration 3 | 1,420,137 | ||
| ssj_ops@calibrated=1,419,804 | |||
| 100% | 99.9% | 1,419,804 | 1,418,677 |
| 90% | 90.1% | 1,277,824 | 1,279,888 |
| 80% | 79.9% | 1,135,843 | 1,134,741 |
| 70% | 70.2% | 993,863 | 996,080 |
| 60% | 60.1% | 851,882 | 853,738 |
| 50% | 50.2% | 709,902 | 712,618 |
| 40% | 40.0% | 567,922 | 567,333 |
| 30% | 29.9% | 425,941 | 424,270 |
| 20% | 20.0% | 283,961 | 283,809 |
| 10% | 10.0% | 141,980 | 141,310 |
| Active Idle | 0 | 0 | |

| Target Load | Actual Load | ssj_ops | |
|---|---|---|---|
| Target | Actual | ||
| Calibration 1 | 1,420,932 | ||
| Calibration 2 | 1,420,119 | ||
| Calibration 3 | 1,425,051 | ||
| ssj_ops@calibrated=1,422,585 | |||
| 100% | 99.8% | 1,422,585 | 1,420,088 |
| 90% | 89.7% | 1,280,327 | 1,276,331 |
| 80% | 80.0% | 1,138,068 | 1,137,544 |
| 70% | 70.0% | 995,810 | 996,317 |
| 60% | 59.9% | 853,551 | 852,821 |
| 50% | 50.1% | 711,293 | 713,383 |
| 40% | 40.0% | 569,034 | 569,720 |
| 30% | 30.0% | 426,776 | 426,943 |
| 20% | 19.9% | 284,517 | 283,125 |
| 10% | 10.0% | 142,259 | 141,730 |
| Active Idle | 0 | 0 | |
