
SPECpower_ssj2008
Host 'WIN-SUT107' Performance Report
Copyright © 2007-2019 Standard Performance Evaluation Corporation
| New H3C Technologies Co., Ltd. H3C UniServer B5700 G3 | ssj_ops@100% = 5,696,089 ssj_ops@100% per JVM = 1,424,022 |
||||
| Test Sponsor: | New H3C Technologies Co., Ltd. | SPEC License #: | 9066 | Test Method: | Multi Node |
| Tested By: | New H3C Technologies Co., Ltd. | Test Location: | Hangzhou, Zhejiang, China | Test Date: | May 13, 2019 |
| Hardware Availability: | Jan-2019 | Software Availability: | Jan-2019 | Publication: | Jun 12, 2019 |
| System Source: | Single Supplier | System Designation: | Server | Power Provisioning: | Line-powered |
| Target Load | Actual Load | ssj_ops | |
|---|---|---|---|
| Target | Actual | ||
| Calibration 1 | 5,705,837 | ||
| Calibration 2 | 5,699,279 | ||
| Calibration 3 | 5,708,981 | ||
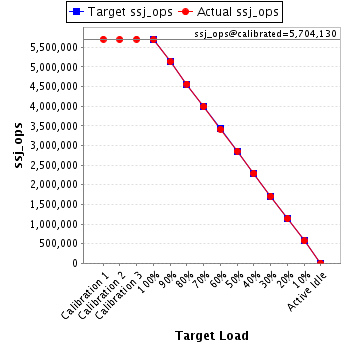
| ssj_ops@calibrated=5,704,130 | |||
| 100% | 99.9% | 5,704,130 | 5,696,089 |
| 90% | 90.1% | 5,133,717 | 5,137,652 |
| 80% | 80.0% | 4,563,304 | 4,566,118 |
| 70% | 70.0% | 3,992,891 | 3,991,903 |
| 60% | 59.9% | 3,422,478 | 3,417,050 |
| 50% | 50.1% | 2,852,065 | 2,858,149 |
| 40% | 40.1% | 2,281,652 | 2,286,463 |
| 30% | 30.0% | 1,711,239 | 1,711,197 |
| 20% | 20.0% | 1,140,826 | 1,138,647 |
| 10% | 10.0% | 570,413 | 569,539 |
| Active Idle | 0 | 0 | |
| Set Identifier: | sut |
| Set Description: | System Under Test |
| # of Identical Nodes: | 12 |
| Comment: | SUT |
| Hardware | |
|---|---|
| Hardware Vendor: | New H3C Technologies Co., Ltd. |
| Model: | H3C UniServer B5700 G3 |
| Form Factor: | Other |
| CPU Name: | Intel Xeon Platinum 8180 2.50GHz |
| CPU Characteristics: | 28-Core, 2.50 GHz, 38.5 MB L3 Cache |
| CPU Frequency (MHz): | 2500 |
| CPU(s) Enabled: | 56 cores, 2 chips, 28 cores/chip |
| Hardware Threads: | 112 (2 / core) |
| CPU(s) Orderable: | 1,2 chips |
| Primary Cache: | 32 KB I + 32 KB D on chip per core |
| Secondary Cache: | 1 MB I+D on chip per core |
| Tertiary Cache: | 39424 KB I+D on chip per chip |
| Other Cache: | None |
| Memory Amount (GB): | 192.0 |
| # and size of DIMM: | 12 x 16384 MB |
| Memory Details: | 12 x 16GB 2Rx8 PC4-2666-V ECC;slots A1, A2, A3, A4, A5, A6, B1, B2, B3, B4, B5, B6 populated |
| Power Supply Quantity and Rating (W): | None |
| Power Supply Details: | Shared |
| Disk Drive: | SATA DOM 128GB P/N DESSH-A28D09BCADCA |
| Disk Controller: | Integrated SATA controller |
| # and type of Network Interface Cards (NICs) Installed: | 1 x Intel I350 Gigabit Ethernet Controller |
| NICs Enabled in Firmware / OS / Connected: | 2/2/1 |
| Network Speed (Mbit): | 1000 |
| Keyboard: | None |
| Mouse: | None |
| Monitor: | None |
| Optical Drives: | No |
| Other Hardware: | None |
| Software | |
|---|---|
| Power Management: | Balanced Mode enabled in OS (see SUT Notes) |
| Operating System (OS): | Microsoft Windows Server 2012 R2 Datacenter |
| OS Version: | Version 6.3 (Build 9600) |
| Filesystem: | NTFS |
| JVM Vendor: | Oracle Corporation |
| JVM Version: | Java HotSpot(TM) 64-Bit Server VM (build 24.80-b11, mixed mode), version 1.7.0_80 |
| JVM Command-line Options: | -server -Xmn19g -Xms21g -Xmx21g -XX:SurvivorRatio=1 -XX:TargetSurvivorRatio=99 -XX:ParallelGCThreads=28 -XX:AllocatePrefetchDistance=256 -XX:AllocatePrefetchLines=4 -XX:LoopUnrollLimit=45 -XX:InitialTenuringThreshold=12 -XX:MaxTenuringThreshold=15 -XX:InlineSmallCode=9000 -XX:MaxInlineSize=270 -XX:FreqInlineSize=6000 -XX:+UseLargePages -XX:+UseParallelOldGC -XX:+AggressiveOpts |
| JVM Affinity: | start /NODE [0,2] /AFFINITY [0xFC0FF00FC0FF];start /NODE [1,3] /AFFINITY [0xFF03F00FF03F] |
| JVM Instances: | 4 |
| JVM Initial Heap (MB): | 21000 |
| JVM Maximum Heap (MB): | 21000 |
| JVM Address Bits: | 64 |
| Boot Firmware Version: | 2.00.25 |
| Management Firmware Version: | UIS-OM 1.00.10 |
| Workload Version: | SSJ 1.2.10 |
| Director Location: | Controller |
| Other Software: | Microsoft Windows KB3021910, clearcompressionflag.exe, KB2919355, KB2932046, KB2959977, KB2937592, KB2938439, KB2934018, KB4056898, patched to this test system in May 8, 2019 |
| JVM Instance | ssj_ops@100% |
|---|---|
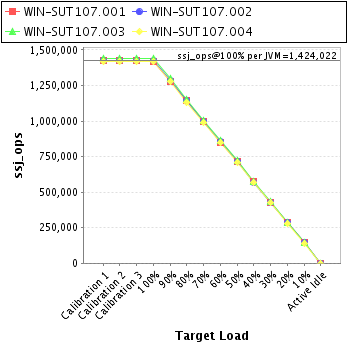
| WIN-SUT107.001 | 1,419,273 |
| WIN-SUT107.002 | 1,424,301 |
| WIN-SUT107.003 | 1,437,405 |
| WIN-SUT107.004 | 1,415,110 |
| ssj_ops@100% | 5,696,089 |
| ssj_ops@100% per JVM | 1,424,022 |
| Target Load | Actual Load | ssj_ops | |
|---|---|---|---|
| Target | Actual | ||
| Calibration 1 | 1,422,658 | ||
| Calibration 2 | 1,422,956 | ||
| Calibration 3 | 1,423,918 | ||
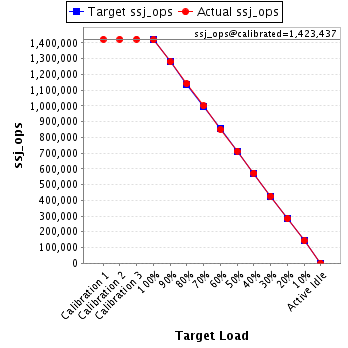
| ssj_ops@calibrated=1,423,437 | |||
| 100% | 99.7% | 1,423,437 | 1,419,273 |
| 90% | 89.9% | 1,281,093 | 1,280,256 |
| 80% | 80.2% | 1,138,750 | 1,141,756 |
| 70% | 70.2% | 996,406 | 999,730 |
| 60% | 59.8% | 854,062 | 850,630 |
| 50% | 50.1% | 711,719 | 712,902 |
| 40% | 40.2% | 569,375 | 572,407 |
| 30% | 30.0% | 427,031 | 427,018 |
| 20% | 19.9% | 284,687 | 283,868 |
| 10% | 10.1% | 142,344 | 143,455 |
| Active Idle | 0 | 0 | |
| Target Load | Actual Load | ssj_ops | |
|---|---|---|---|
| Target | Actual | ||
| Calibration 1 | 1,428,014 | ||
| Calibration 2 | 1,423,074 | ||
| Calibration 3 | 1,426,102 | ||
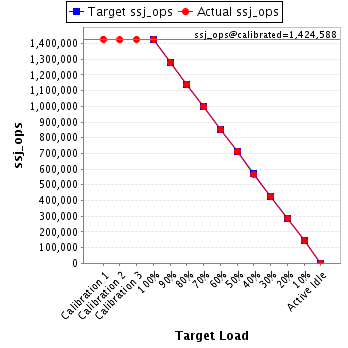
| ssj_ops@calibrated=1,424,588 | |||
| 100% | 100.0% | 1,424,588 | 1,424,301 |
| 90% | 90.0% | 1,282,129 | 1,281,685 |
| 80% | 80.1% | 1,139,670 | 1,141,494 |
| 70% | 70.0% | 997,211 | 996,721 |
| 60% | 60.0% | 854,753 | 855,132 |
| 50% | 50.0% | 712,294 | 712,547 |
| 40% | 39.9% | 569,835 | 567,771 |
| 30% | 30.1% | 427,376 | 428,239 |
| 20% | 20.1% | 284,918 | 286,089 |
| 10% | 10.0% | 142,459 | 142,465 |
| Active Idle | 0 | 0 | |
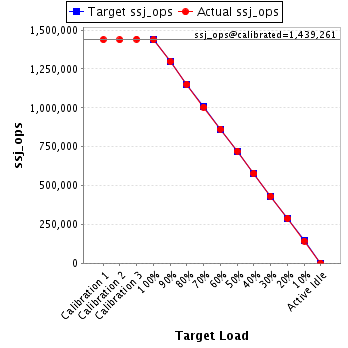
| Target Load | Actual Load | ssj_ops | |
|---|---|---|---|
| Target | Actual | ||
| Calibration 1 | 1,437,855 | ||
| Calibration 2 | 1,436,837 | ||
| Calibration 3 | 1,441,685 | ||
| ssj_ops@calibrated=1,439,261 | |||
| 100% | 99.9% | 1,439,261 | 1,437,405 |
| 90% | 90.2% | 1,295,335 | 1,297,808 |
| 80% | 79.9% | 1,151,409 | 1,150,596 |
| 70% | 69.8% | 1,007,483 | 1,005,072 |
| 60% | 60.0% | 863,557 | 863,433 |
| 50% | 50.1% | 719,631 | 721,665 |
| 40% | 40.0% | 575,704 | 576,275 |
| 30% | 30.0% | 431,778 | 431,876 |
| 20% | 20.0% | 287,852 | 288,375 |
| 10% | 9.9% | 143,926 | 143,097 |
| Active Idle | 0 | 0 | |
| Target Load | Actual Load | ssj_ops | |
|---|---|---|---|
| Target | Actual | ||
| Calibration 1 | 1,417,310 | ||
| Calibration 2 | 1,416,412 | ||
| Calibration 3 | 1,417,276 | ||
| ssj_ops@calibrated=1,416,844 | |||
| 100% | 99.9% | 1,416,844 | 1,415,110 |
| 90% | 90.2% | 1,275,159 | 1,277,903 |
| 80% | 79.9% | 1,133,475 | 1,132,272 |
| 70% | 69.9% | 991,791 | 990,380 |
| 60% | 59.8% | 850,106 | 847,855 |
| 50% | 50.2% | 708,422 | 711,035 |
| 40% | 40.2% | 566,737 | 570,009 |
| 30% | 29.9% | 425,053 | 424,063 |
| 20% | 19.8% | 283,369 | 280,315 |
| 10% | 9.9% | 141,684 | 140,522 |
| Active Idle | 0 | 0 | |
