SPECpower_ssj2008
Host 'WIN-SUT110' Performance Report
Copyright © 2007-2019 Standard Performance Evaluation Corporation
| New H3C Technologies Co., Ltd. H3C UniServer B5700 G3 | ssj_ops@100% = 5,707,706 ssj_ops@100% per JVM = 1,426,926 |
||||
| Test Sponsor: | New H3C Technologies Co., Ltd. | SPEC License #: | 9066 | Test Method: | Multi Node |
| Tested By: | New H3C Technologies Co., Ltd. | Test Location: | Hangzhou, Zhejiang, China | Test Date: | May 13, 2019 |
| Hardware Availability: | Jan-2019 | Software Availability: | Jan-2019 | Publication: | Jun 12, 2019 |
| System Source: | Single Supplier | System Designation: | Server | Power Provisioning: | Line-powered |
| Target Load | Actual Load | ssj_ops | |
|---|---|---|---|
| Target | Actual | ||
| Calibration 1 | 5,717,795 | ||
| Calibration 2 | 5,712,541 | ||
| Calibration 3 | 5,727,529 | ||
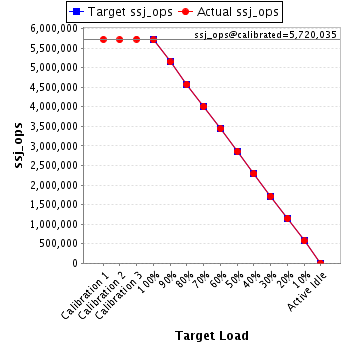
| ssj_ops@calibrated=5,720,035 | |||
| 100% | 99.8% | 5,720,035 | 5,707,706 |
| 90% | 90.0% | 5,148,032 | 5,146,537 |
| 80% | 79.9% | 4,576,028 | 4,568,380 |
| 70% | 70.1% | 4,004,025 | 4,008,006 |
| 60% | 60.1% | 3,432,021 | 3,435,852 |
| 50% | 50.0% | 2,860,018 | 2,858,809 |
| 40% | 40.0% | 2,288,014 | 2,285,833 |
| 30% | 30.0% | 1,716,011 | 1,716,063 |
| 20% | 20.1% | 1,144,007 | 1,148,387 |
| 10% | 10.0% | 572,004 | 571,720 |
| Active Idle | 0 | 0 | |
| Set Identifier: | sut |
| Set Description: | System Under Test |
| # of Identical Nodes: | 12 |
| Comment: | SUT |
| Hardware | |
|---|---|
| Hardware Vendor: | New H3C Technologies Co., Ltd. |
| Model: | H3C UniServer B5700 G3 |
| Form Factor: | Other |
| CPU Name: | Intel Xeon Platinum 8180 2.50GHz |
| CPU Characteristics: | 28-Core, 2.50 GHz, 38.5 MB L3 Cache |
| CPU Frequency (MHz): | 2500 |
| CPU(s) Enabled: | 56 cores, 2 chips, 28 cores/chip |
| Hardware Threads: | 112 (2 / core) |
| CPU(s) Orderable: | 1,2 chips |
| Primary Cache: | 32 KB I + 32 KB D on chip per core |
| Secondary Cache: | 1 MB I+D on chip per core |
| Tertiary Cache: | 39424 KB I+D on chip per chip |
| Other Cache: | None |
| Memory Amount (GB): | 192.0 |
| # and size of DIMM: | 12 x 16384 MB |
| Memory Details: | 12 x 16GB 2Rx8 PC4-2666-V ECC;slots A1, A2, A3, A4, A5, A6, B1, B2, B3, B4, B5, B6 populated |
| Power Supply Quantity and Rating (W): | None |
| Power Supply Details: | Shared |
| Disk Drive: | SATA DOM 128GB P/N DESSH-A28D09BCADCA |
| Disk Controller: | Integrated SATA controller |
| # and type of Network Interface Cards (NICs) Installed: | 1 x Intel I350 Gigabit Ethernet Controller |
| NICs Enabled in Firmware / OS / Connected: | 2/2/1 |
| Network Speed (Mbit): | 1000 |
| Keyboard: | None |
| Mouse: | None |
| Monitor: | None |
| Optical Drives: | No |
| Other Hardware: | None |
| Software | |
|---|---|
| Power Management: | Balanced Mode enabled in OS (see SUT Notes) |
| Operating System (OS): | Microsoft Windows Server 2012 R2 Datacenter |
| OS Version: | Version 6.3 (Build 9600) |
| Filesystem: | NTFS |
| JVM Vendor: | Oracle Corporation |
| JVM Version: | Java HotSpot(TM) 64-Bit Server VM (build 24.80-b11, mixed mode), version 1.7.0_80 |
| JVM Command-line Options: | -server -Xmn19g -Xms21g -Xmx21g -XX:SurvivorRatio=1 -XX:TargetSurvivorRatio=99 -XX:ParallelGCThreads=28 -XX:AllocatePrefetchDistance=256 -XX:AllocatePrefetchLines=4 -XX:LoopUnrollLimit=45 -XX:InitialTenuringThreshold=12 -XX:MaxTenuringThreshold=15 -XX:InlineSmallCode=9000 -XX:MaxInlineSize=270 -XX:FreqInlineSize=6000 -XX:+UseLargePages -XX:+UseParallelOldGC -XX:+AggressiveOpts |
| JVM Affinity: | start /NODE [0,2] /AFFINITY [0xFC0FF00FC0FF];start /NODE [1,3] /AFFINITY [0xFF03F00FF03F] |
| JVM Instances: | 4 |
| JVM Initial Heap (MB): | 21000 |
| JVM Maximum Heap (MB): | 21000 |
| JVM Address Bits: | 64 |
| Boot Firmware Version: | 2.00.25 |
| Management Firmware Version: | UIS-OM 1.00.10 |
| Workload Version: | SSJ 1.2.10 |
| Director Location: | Controller |
| Other Software: | Microsoft Windows KB3021910, clearcompressionflag.exe, KB2919355, KB2932046, KB2959977, KB2937592, KB2938439, KB2934018, KB4056898, patched to this test system in May 8, 2019 |
| JVM Instance | ssj_ops@100% |
|---|---|
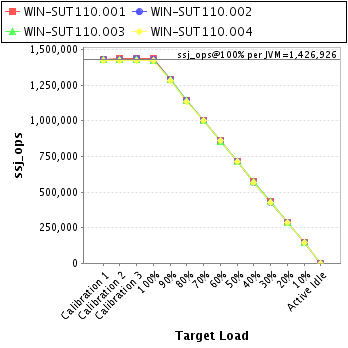
| WIN-SUT110.001 | 1,433,709 |
| WIN-SUT110.002 | 1,427,492 |
| WIN-SUT110.003 | 1,426,227 |
| WIN-SUT110.004 | 1,420,277 |
| ssj_ops@100% | 5,707,706 |
| ssj_ops@100% per JVM | 1,426,926 |
| Target Load | Actual Load | ssj_ops | |
|---|---|---|---|
| Target | Actual | ||
| Calibration 1 | 1,432,696 | ||
| Calibration 2 | 1,433,528 | ||
| Calibration 3 | 1,439,112 | ||
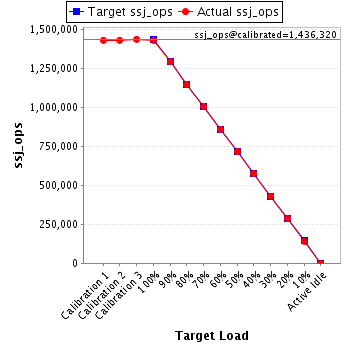
| ssj_ops@calibrated=1,436,320 | |||
| 100% | 99.8% | 1,436,320 | 1,433,709 |
| 90% | 90.0% | 1,292,688 | 1,292,505 |
| 80% | 79.8% | 1,149,056 | 1,145,538 |
| 70% | 69.9% | 1,005,424 | 1,003,981 |
| 60% | 59.9% | 861,792 | 860,537 |
| 50% | 49.9% | 718,160 | 717,133 |
| 40% | 40.1% | 574,528 | 575,258 |
| 30% | 30.0% | 430,896 | 431,012 |
| 20% | 20.1% | 287,264 | 288,795 |
| 10% | 9.9% | 143,632 | 142,883 |
| Active Idle | 0 | 0 | |
| Target Load | Actual Load | ssj_ops | |
|---|---|---|---|
| Target | Actual | ||
| Calibration 1 | 1,430,922 | ||
| Calibration 2 | 1,428,883 | ||
| Calibration 3 | 1,433,360 | ||
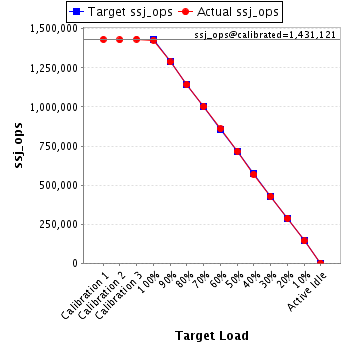
| ssj_ops@calibrated=1,431,121 | |||
| 100% | 99.7% | 1,431,121 | 1,427,492 |
| 90% | 90.0% | 1,288,009 | 1,287,709 |
| 80% | 79.8% | 1,144,897 | 1,142,572 |
| 70% | 70.1% | 1,001,785 | 1,003,022 |
| 60% | 60.1% | 858,673 | 859,812 |
| 50% | 50.0% | 715,561 | 716,067 |
| 40% | 39.7% | 572,449 | 568,801 |
| 30% | 29.9% | 429,336 | 427,903 |
| 20% | 20.1% | 286,224 | 287,953 |
| 10% | 10.0% | 143,112 | 143,361 |
| Active Idle | 0 | 0 | |
| Target Load | Actual Load | ssj_ops | |
|---|---|---|---|
| Target | Actual | ||
| Calibration 1 | 1,430,181 | ||
| Calibration 2 | 1,428,336 | ||
| Calibration 3 | 1,430,656 | ||
| ssj_ops@calibrated=1,429,496 | |||
| 100% | 99.8% | 1,429,496 | 1,426,227 |
| 90% | 90.0% | 1,286,547 | 1,286,766 |
| 80% | 80.1% | 1,143,597 | 1,144,794 |
| 70% | 70.1% | 1,000,647 | 1,002,280 |
| 60% | 59.9% | 857,698 | 856,228 |
| 50% | 49.9% | 714,748 | 713,470 |
| 40% | 40.1% | 571,798 | 573,218 |
| 30% | 30.1% | 428,849 | 430,446 |
| 20% | 20.1% | 285,899 | 287,209 |
| 10% | 10.0% | 142,950 | 143,164 |
| Active Idle | 0 | 0 | |

| Target Load | Actual Load | ssj_ops | |
|---|---|---|---|
| Target | Actual | ||
| Calibration 1 | 1,423,996 | ||
| Calibration 2 | 1,421,795 | ||
| Calibration 3 | 1,424,401 | ||
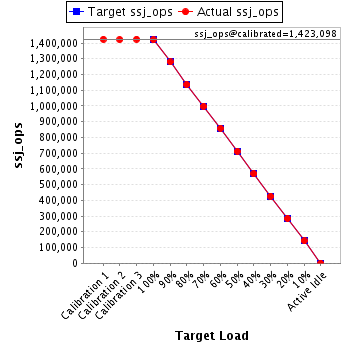
| ssj_ops@calibrated=1,423,098 | |||
| 100% | 99.8% | 1,423,098 | 1,420,277 |
| 90% | 89.9% | 1,280,788 | 1,279,558 |
| 80% | 79.8% | 1,138,478 | 1,135,476 |
| 70% | 70.2% | 996,169 | 998,723 |
| 60% | 60.4% | 853,859 | 859,275 |
| 50% | 50.0% | 711,549 | 712,139 |
| 40% | 40.0% | 569,239 | 568,557 |
| 30% | 30.0% | 426,929 | 426,701 |
| 20% | 20.0% | 284,620 | 284,430 |
| 10% | 10.0% | 142,310 | 142,313 |
| Active Idle | 0 | 0 | |