SPECpower_ssj2008
Host 'WIN-SUT112' Performance Report
Copyright © 2007-2019 Standard Performance Evaluation Corporation
| New H3C Technologies Co., Ltd. H3C UniServer B5700 G3 | ssj_ops@100% = 5,674,130 ssj_ops@100% per JVM = 1,418,533 |
||||
| Test Sponsor: | New H3C Technologies Co., Ltd. | SPEC License #: | 9066 | Test Method: | Multi Node |
| Tested By: | New H3C Technologies Co., Ltd. | Test Location: | Hangzhou, Zhejiang, China | Test Date: | May 13, 2019 |
| Hardware Availability: | Jan-2019 | Software Availability: | Jan-2019 | Publication: | Jun 12, 2019 |
| System Source: | Single Supplier | System Designation: | Server | Power Provisioning: | Line-powered |
| Target Load | Actual Load | ssj_ops | |
|---|---|---|---|
| Target | Actual | ||
| Calibration 1 | 5,685,380 | ||
| Calibration 2 | 5,674,522 | ||
| Calibration 3 | 5,685,652 | ||
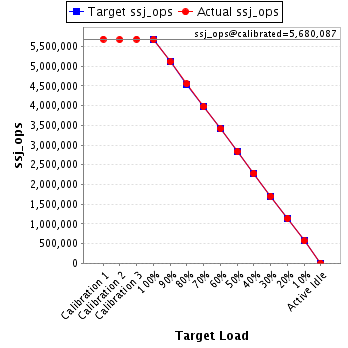
| ssj_ops@calibrated=5,680,087 | |||
| 100% | 99.9% | 5,680,087 | 5,674,130 |
| 90% | 90.0% | 5,112,078 | 5,111,774 |
| 80% | 80.2% | 4,544,070 | 4,554,742 |
| 70% | 70.0% | 3,976,061 | 3,976,497 |
| 60% | 60.0% | 3,408,052 | 3,410,700 |
| 50% | 49.9% | 2,840,044 | 2,835,772 |
| 40% | 40.1% | 2,272,035 | 2,276,863 |
| 30% | 30.0% | 1,704,026 | 1,704,333 |
| 20% | 20.1% | 1,136,017 | 1,139,983 |
| 10% | 10.0% | 568,009 | 569,098 |
| Active Idle | 0 | 0 | |
| Set Identifier: | sut |
| Set Description: | System Under Test |
| # of Identical Nodes: | 12 |
| Comment: | SUT |
| Hardware | |
|---|---|
| Hardware Vendor: | New H3C Technologies Co., Ltd. |
| Model: | H3C UniServer B5700 G3 |
| Form Factor: | Other |
| CPU Name: | Intel Xeon Platinum 8180 2.50GHz |
| CPU Characteristics: | 28-Core, 2.50 GHz, 38.5 MB L3 Cache |
| CPU Frequency (MHz): | 2500 |
| CPU(s) Enabled: | 56 cores, 2 chips, 28 cores/chip |
| Hardware Threads: | 112 (2 / core) |
| CPU(s) Orderable: | 1,2 chips |
| Primary Cache: | 32 KB I + 32 KB D on chip per core |
| Secondary Cache: | 1 MB I+D on chip per core |
| Tertiary Cache: | 39424 KB I+D on chip per chip |
| Other Cache: | None |
| Memory Amount (GB): | 192.0 |
| # and size of DIMM: | 12 x 16384 MB |
| Memory Details: | 12 x 16GB 2Rx8 PC4-2666-V ECC;slots A1, A2, A3, A4, A5, A6, B1, B2, B3, B4, B5, B6 populated |
| Power Supply Quantity and Rating (W): | None |
| Power Supply Details: | Shared |
| Disk Drive: | SATA DOM 128GB P/N DESSH-A28D09BCADCA |
| Disk Controller: | Integrated SATA controller |
| # and type of Network Interface Cards (NICs) Installed: | 1 x Intel I350 Gigabit Ethernet Controller |
| NICs Enabled in Firmware / OS / Connected: | 2/2/1 |
| Network Speed (Mbit): | 1000 |
| Keyboard: | None |
| Mouse: | None |
| Monitor: | None |
| Optical Drives: | No |
| Other Hardware: | None |
| Software | |
|---|---|
| Power Management: | Balanced Mode enabled in OS (see SUT Notes) |
| Operating System (OS): | Microsoft Windows Server 2012 R2 Datacenter |
| OS Version: | Version 6.3 (Build 9600) |
| Filesystem: | NTFS |
| JVM Vendor: | Oracle Corporation |
| JVM Version: | Java HotSpot(TM) 64-Bit Server VM (build 24.80-b11, mixed mode), version 1.7.0_80 |
| JVM Command-line Options: | -server -Xmn19g -Xms21g -Xmx21g -XX:SurvivorRatio=1 -XX:TargetSurvivorRatio=99 -XX:ParallelGCThreads=28 -XX:AllocatePrefetchDistance=256 -XX:AllocatePrefetchLines=4 -XX:LoopUnrollLimit=45 -XX:InitialTenuringThreshold=12 -XX:MaxTenuringThreshold=15 -XX:InlineSmallCode=9000 -XX:MaxInlineSize=270 -XX:FreqInlineSize=6000 -XX:+UseLargePages -XX:+UseParallelOldGC -XX:+AggressiveOpts |
| JVM Affinity: | start /NODE [0,2] /AFFINITY [0xFC0FF00FC0FF];start /NODE [1,3] /AFFINITY [0xFF03F00FF03F] |
| JVM Instances: | 4 |
| JVM Initial Heap (MB): | 21000 |
| JVM Maximum Heap (MB): | 21000 |
| JVM Address Bits: | 64 |
| Boot Firmware Version: | 2.00.25 |
| Management Firmware Version: | UIS-OM 1.00.10 |
| Workload Version: | SSJ 1.2.10 |
| Director Location: | Controller |
| Other Software: | Microsoft Windows KB3021910, clearcompressionflag.exe, KB2919355, KB2932046, KB2959977, KB2937592, KB2938439, KB2934018, KB4056898, patched to this test system in May 8, 2019 |
| JVM Instance | ssj_ops@100% |
|---|---|
| WIN-SUT112.001 | 1,426,927 |
| WIN-SUT112.002 | 1,409,692 |
| WIN-SUT112.003 | 1,421,418 |
| WIN-SUT112.004 | 1,416,093 |
| ssj_ops@100% | 5,674,130 |
| ssj_ops@100% per JVM | 1,418,533 |

| Target Load | Actual Load | ssj_ops | |
|---|---|---|---|
| Target | Actual | ||
| Calibration 1 | 1,429,093 | ||
| Calibration 2 | 1,428,641 | ||
| Calibration 3 | 1,432,372 | ||
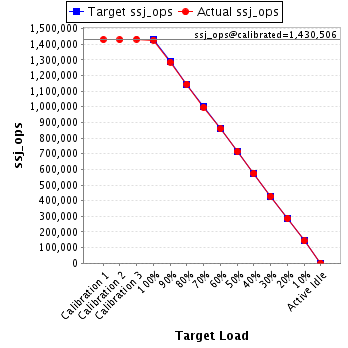
| ssj_ops@calibrated=1,430,506 | |||
| 100% | 99.7% | 1,430,506 | 1,426,927 |
| 90% | 89.9% | 1,287,456 | 1,285,827 |
| 80% | 80.0% | 1,144,405 | 1,144,125 |
| 70% | 69.7% | 1,001,355 | 997,220 |
| 60% | 60.0% | 858,304 | 858,876 |
| 50% | 49.9% | 715,253 | 714,475 |
| 40% | 40.1% | 572,203 | 573,850 |
| 30% | 30.0% | 429,152 | 428,578 |
| 20% | 20.1% | 286,101 | 286,843 |
| 10% | 10.0% | 143,051 | 143,147 |
| Active Idle | 0 | 0 | |
| Target Load | Actual Load | ssj_ops | |
|---|---|---|---|
| Target | Actual | ||
| Calibration 1 | 1,416,179 | ||
| Calibration 2 | 1,412,012 | ||
| Calibration 3 | 1,412,340 | ||
| ssj_ops@calibrated=1,412,176 | |||
| 100% | 99.8% | 1,412,176 | 1,409,692 |
| 90% | 89.9% | 1,270,958 | 1,269,214 |
| 80% | 80.1% | 1,129,741 | 1,131,436 |
| 70% | 70.1% | 988,523 | 989,797 |
| 60% | 60.3% | 847,305 | 851,119 |
| 50% | 50.0% | 706,088 | 705,800 |
| 40% | 40.0% | 564,870 | 564,989 |
| 30% | 30.2% | 423,653 | 425,822 |
| 20% | 20.0% | 282,435 | 283,000 |
| 10% | 10.0% | 141,218 | 140,716 |
| Active Idle | 0 | 0 | |

| Target Load | Actual Load | ssj_ops | |
|---|---|---|---|
| Target | Actual | ||
| Calibration 1 | 1,420,531 | ||
| Calibration 2 | 1,418,042 | ||
| Calibration 3 | 1,423,193 | ||
| ssj_ops@calibrated=1,420,618 | |||
| 100% | 100.1% | 1,420,618 | 1,421,418 |
| 90% | 90.2% | 1,278,556 | 1,281,959 |
| 80% | 80.3% | 1,136,494 | 1,140,145 |
| 70% | 70.1% | 994,432 | 996,146 |
| 60% | 59.9% | 852,371 | 851,185 |
| 50% | 49.9% | 710,309 | 708,789 |
| 40% | 40.1% | 568,247 | 570,071 |
| 30% | 30.1% | 426,185 | 427,788 |
| 20% | 20.0% | 284,124 | 284,634 |
| 10% | 10.1% | 142,062 | 143,172 |
| Active Idle | 0 | 0 | |

| Target Load | Actual Load | ssj_ops | |
|---|---|---|---|
| Target | Actual | ||
| Calibration 1 | 1,419,577 | ||
| Calibration 2 | 1,415,827 | ||
| Calibration 3 | 1,417,748 | ||
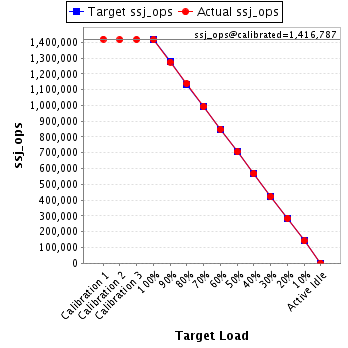
| ssj_ops@calibrated=1,416,787 | |||
| 100% | 100.0% | 1,416,787 | 1,416,093 |
| 90% | 90.0% | 1,275,109 | 1,274,775 |
| 80% | 80.4% | 1,133,430 | 1,139,037 |
| 70% | 70.1% | 991,751 | 993,334 |
| 60% | 60.0% | 850,072 | 849,520 |
| 50% | 49.9% | 708,394 | 706,708 |
| 40% | 40.1% | 566,715 | 567,953 |
| 30% | 29.8% | 425,036 | 422,146 |
| 20% | 20.2% | 283,357 | 285,506 |
| 10% | 10.0% | 141,679 | 142,062 |
| Active Idle | 0 | 0 | |