
SPECpower_ssj2008
Host 'WIN-SUT107' Performance Report
Copyright © 2007-2019 Standard Performance Evaluation Corporation
| New H3C Technologies Co., Ltd. H3C UniServer B5700 G3 | ssj_ops@100% = 5,699,896 ssj_ops@100% per JVM = 1,424,974 |
||||
| Test Sponsor: | New H3C Technologies Co., Ltd. | SPEC License #: | 9066 | Test Method: | Multi Node |
| Tested By: | New H3C Technologies Co., Ltd. | Test Location: | Hangzhou, Zhejiang, China | Test Date: | May 17, 2019 |
| Hardware Availability: | Jan-2019 | Software Availability: | Jan-2019 | Publication: | Jun 12, 2019 |
| System Source: | Single Supplier | System Designation: | Server | Power Provisioning: | Line-powered |
| Target Load | Actual Load | ssj_ops | |
|---|---|---|---|
| Target | Actual | ||
| Calibration 1 | 5,704,307 | ||
| Calibration 2 | 5,697,193 | ||
| Calibration 3 | 5,708,815 | ||
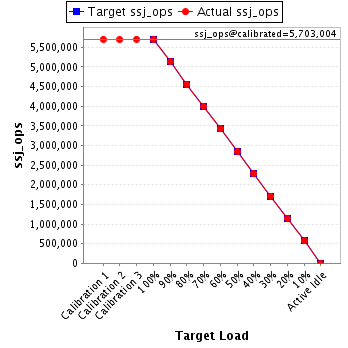
| ssj_ops@calibrated=5,703,004 | |||
| 100% | 99.9% | 5,703,004 | 5,699,896 |
| 90% | 90.0% | 5,132,704 | 5,131,055 |
| 80% | 80.0% | 4,562,403 | 4,562,922 |
| 70% | 70.0% | 3,992,103 | 3,992,206 |
| 60% | 60.0% | 3,421,802 | 3,422,836 |
| 50% | 49.9% | 2,851,502 | 2,847,369 |
| 40% | 40.0% | 2,281,202 | 2,281,377 |
| 30% | 30.0% | 1,710,901 | 1,712,727 |
| 20% | 20.0% | 1,140,601 | 1,140,617 |
| 10% | 10.0% | 570,300 | 570,568 |
| Active Idle | 0 | 0 | |
| Set Identifier: | sut |
| Set Description: | System Under Test |
| # of Identical Nodes: | 13 |
| Comment: | SUT |
| Hardware | |
|---|---|
| Hardware Vendor: | New H3C Technologies Co., Ltd. |
| Model: | H3C UniServer B5700 G3 |
| Form Factor: | Other |
| CPU Name: | Intel Xeon Platinum 8180 2.50GHz |
| CPU Characteristics: | 28-Core, 2.50 GHz, 38.5 MB L3 Cache |
| CPU Frequency (MHz): | 2500 |
| CPU(s) Enabled: | 56 cores, 2 chips, 28 cores/chip |
| Hardware Threads: | 112 (2 / core) |
| CPU(s) Orderable: | 1,2 chips |
| Primary Cache: | 32 KB I + 32 KB D on chip per core |
| Secondary Cache: | 1 MB I+D on chip per core |
| Tertiary Cache: | 39424 KB I+D on chip per chip |
| Other Cache: | None |
| Memory Amount (GB): | 192.0 |
| # and size of DIMM: | 12 x 16384 MB |
| Memory Details: | 12 x 16GB 2Rx8 PC4-2666-V ECC;slots A1, A2, A3, A4, A5, A6, B1, B2, B3, B4, B5, B6 populated |
| Power Supply Quantity and Rating (W): | None |
| Power Supply Details: | Shared |
| Disk Drive: | SATA DOM 128GB P/N DESSH-A28D09BCADCA |
| Disk Controller: | Integrated SATA controller |
| # and type of Network Interface Cards (NICs) Installed: | 1 x Intel I350 Gigabit Ethernet Controller |
| NICs Enabled in Firmware / OS / Connected: | 2/2/1 |
| Network Speed (Mbit): | 1000 |
| Keyboard: | None |
| Mouse: | None |
| Monitor: | None |
| Optical Drives: | No |
| Other Hardware: | None |
| Software | |
|---|---|
| Power Management: | Balanced Mode enabled in OS (see SUT Notes) |
| Operating System (OS): | Microsoft Windows Server 2012 R2 Datacenter |
| OS Version: | Version 6.3 (Build 9600) |
| Filesystem: | NTFS |
| JVM Vendor: | Oracle Corporation |
| JVM Version: | Java HotSpot(TM) 64-Bit Server VM (build 24.80-b11, mixed mode), version 1.7.0_80 |
| JVM Command-line Options: | -server -Xmn19g -Xms21g -Xmx21g -XX:SurvivorRatio=1 -XX:TargetSurvivorRatio=99 -XX:ParallelGCThreads=28 -XX:AllocatePrefetchDistance=256 -XX:AllocatePrefetchLines=4 -XX:LoopUnrollLimit=45 -XX:InitialTenuringThreshold=12 -XX:MaxTenuringThreshold=15 -XX:InlineSmallCode=9000 -XX:MaxInlineSize=270 -XX:FreqInlineSize=6000 -XX:+UseLargePages -XX:+UseParallelOldGC -XX:+AggressiveOpts |
| JVM Affinity: | start /NODE [0,2] /AFFINITY [0xFC0FF00FC0FF];start /NODE [1,3] /AFFINITY [0xFF03F00FF03F] |
| JVM Instances: | 4 |
| JVM Initial Heap (MB): | 21000 |
| JVM Maximum Heap (MB): | 21000 |
| JVM Address Bits: | 64 |
| Boot Firmware Version: | 2.00.25 |
| Management Firmware Version: | UIS-OM 1.00.10 |
| Workload Version: | SSJ 1.2.10 |
| Director Location: | Controller |
| Other Software: | Microsoft Windows KB3021910, clearcompressionflag.exe, KB2919355, KB2932046, KB2959977, KB2937592, KB2938439, KB2934018, KB4056898, patched to this test system in May 15, 2019 |
| JVM Instance | ssj_ops@100% |
|---|---|
| WIN-SUT107.001 | 1,416,377 |
| WIN-SUT107.002 | 1,425,255 |
| WIN-SUT107.003 | 1,436,581 |
| WIN-SUT107.004 | 1,421,683 |
| ssj_ops@100% | 5,699,896 |
| ssj_ops@100% per JVM | 1,424,974 |

| Target Load | Actual Load | ssj_ops | |
|---|---|---|---|
| Target | Actual | ||
| Calibration 1 | 1,417,165 | ||
| Calibration 2 | 1,418,080 | ||
| Calibration 3 | 1,417,595 | ||
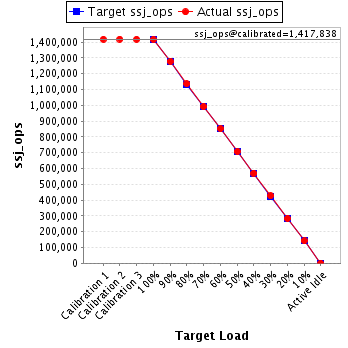
| ssj_ops@calibrated=1,417,838 | |||
| 100% | 99.9% | 1,417,838 | 1,416,377 |
| 90% | 90.1% | 1,276,054 | 1,277,503 |
| 80% | 80.1% | 1,134,270 | 1,136,009 |
| 70% | 69.9% | 992,486 | 991,607 |
| 60% | 60.0% | 850,703 | 850,884 |
| 50% | 49.9% | 708,919 | 706,969 |
| 40% | 40.2% | 567,135 | 569,279 |
| 30% | 30.1% | 425,351 | 426,560 |
| 20% | 20.0% | 283,568 | 283,074 |
| 10% | 10.0% | 141,784 | 141,909 |
| Active Idle | 0 | 0 | |
| Target Load | Actual Load | ssj_ops | |
|---|---|---|---|
| Target | Actual | ||
| Calibration 1 | 1,425,478 | ||
| Calibration 2 | 1,422,769 | ||
| Calibration 3 | 1,428,884 | ||
| ssj_ops@calibrated=1,425,827 | |||
| 100% | 100.0% | 1,425,827 | 1,425,255 |
| 90% | 90.0% | 1,283,244 | 1,283,589 |
| 80% | 79.9% | 1,140,661 | 1,139,910 |
| 70% | 69.7% | 998,079 | 994,111 |
| 60% | 60.2% | 855,496 | 858,226 |
| 50% | 49.9% | 712,913 | 711,265 |
| 40% | 39.8% | 570,331 | 568,160 |
| 30% | 30.0% | 427,748 | 427,993 |
| 20% | 20.0% | 285,165 | 285,143 |
| 10% | 10.0% | 142,583 | 141,944 |
| Active Idle | 0 | 0 | |

| Target Load | Actual Load | ssj_ops | |
|---|---|---|---|
| Target | Actual | ||
| Calibration 1 | 1,436,299 | ||
| Calibration 2 | 1,435,825 | ||
| Calibration 3 | 1,437,972 | ||
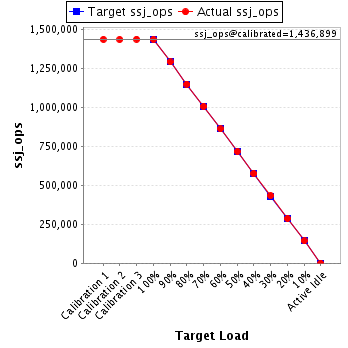
| ssj_ops@calibrated=1,436,899 | |||
| 100% | 100.0% | 1,436,899 | 1,436,581 |
| 90% | 89.9% | 1,293,209 | 1,291,739 |
| 80% | 80.0% | 1,149,519 | 1,149,215 |
| 70% | 70.1% | 1,005,829 | 1,007,850 |
| 60% | 60.0% | 862,139 | 861,603 |
| 50% | 49.9% | 718,449 | 717,351 |
| 40% | 40.0% | 574,759 | 575,006 |
| 30% | 30.1% | 431,070 | 433,073 |
| 20% | 19.9% | 287,380 | 286,231 |
| 10% | 10.0% | 143,690 | 143,531 |
| Active Idle | 0 | 0 | |
| Target Load | Actual Load | ssj_ops | |
|---|---|---|---|
| Target | Actual | ||
| Calibration 1 | 1,425,366 | ||
| Calibration 2 | 1,420,519 | ||
| Calibration 3 | 1,424,363 | ||
| ssj_ops@calibrated=1,422,441 | |||
| 100% | 99.9% | 1,422,441 | 1,421,683 |
| 90% | 89.9% | 1,280,197 | 1,278,224 |
| 80% | 80.0% | 1,137,953 | 1,137,788 |
| 70% | 70.2% | 995,709 | 998,638 |
| 60% | 59.9% | 853,465 | 852,124 |
| 50% | 50.0% | 711,220 | 711,784 |
| 40% | 40.0% | 568,976 | 568,932 |
| 30% | 29.9% | 426,732 | 425,101 |
| 20% | 20.1% | 284,488 | 286,169 |
| 10% | 10.1% | 142,244 | 143,183 |
| Active Idle | 0 | 0 | |
