SPECpower_ssj2008
Host 'WIN-SUT108' Performance Report
Copyright © 2007-2019 Standard Performance Evaluation Corporation
| New H3C Technologies Co., Ltd. H3C UniServer B5700 G3 | ssj_ops@100% = 5,691,201 ssj_ops@100% per JVM = 1,422,800 |
||||
| Test Sponsor: | New H3C Technologies Co., Ltd. | SPEC License #: | 9066 | Test Method: | Multi Node |
| Tested By: | New H3C Technologies Co., Ltd. | Test Location: | Hangzhou, Zhejiang, China | Test Date: | May 17, 2019 |
| Hardware Availability: | Jan-2019 | Software Availability: | Jan-2019 | Publication: | Jun 12, 2019 |
| System Source: | Single Supplier | System Designation: | Server | Power Provisioning: | Line-powered |
| Target Load | Actual Load | ssj_ops | |
|---|---|---|---|
| Target | Actual | ||
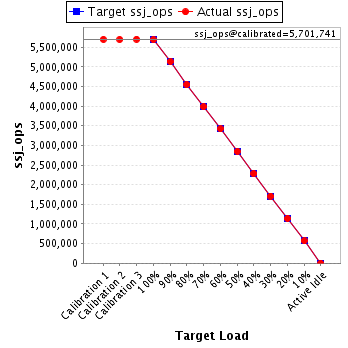
| Calibration 1 | 5,700,571 | ||
| Calibration 2 | 5,697,817 | ||
| Calibration 3 | 5,705,664 | ||
| ssj_ops@calibrated=5,701,741 | |||
| 100% | 99.8% | 5,701,741 | 5,691,201 |
| 90% | 90.0% | 5,131,567 | 5,134,040 |
| 80% | 79.8% | 4,561,393 | 4,549,786 |
| 70% | 69.9% | 3,991,219 | 3,984,790 |
| 60% | 60.0% | 3,421,044 | 3,419,482 |
| 50% | 50.0% | 2,850,870 | 2,849,312 |
| 40% | 40.0% | 2,280,696 | 2,279,335 |
| 30% | 30.0% | 1,710,522 | 1,712,338 |
| 20% | 20.0% | 1,140,348 | 1,140,539 |
| 10% | 10.0% | 570,174 | 569,770 |
| Active Idle | 0 | 0 | |
| Set Identifier: | sut |
| Set Description: | System Under Test |
| # of Identical Nodes: | 13 |
| Comment: | SUT |
| Hardware | |
|---|---|
| Hardware Vendor: | New H3C Technologies Co., Ltd. |
| Model: | H3C UniServer B5700 G3 |
| Form Factor: | Other |
| CPU Name: | Intel Xeon Platinum 8180 2.50GHz |
| CPU Characteristics: | 28-Core, 2.50 GHz, 38.5 MB L3 Cache |
| CPU Frequency (MHz): | 2500 |
| CPU(s) Enabled: | 56 cores, 2 chips, 28 cores/chip |
| Hardware Threads: | 112 (2 / core) |
| CPU(s) Orderable: | 1,2 chips |
| Primary Cache: | 32 KB I + 32 KB D on chip per core |
| Secondary Cache: | 1 MB I+D on chip per core |
| Tertiary Cache: | 39424 KB I+D on chip per chip |
| Other Cache: | None |
| Memory Amount (GB): | 192.0 |
| # and size of DIMM: | 12 x 16384 MB |
| Memory Details: | 12 x 16GB 2Rx8 PC4-2666-V ECC;slots A1, A2, A3, A4, A5, A6, B1, B2, B3, B4, B5, B6 populated |
| Power Supply Quantity and Rating (W): | None |
| Power Supply Details: | Shared |
| Disk Drive: | SATA DOM 128GB P/N DESSH-A28D09BCADCA |
| Disk Controller: | Integrated SATA controller |
| # and type of Network Interface Cards (NICs) Installed: | 1 x Intel I350 Gigabit Ethernet Controller |
| NICs Enabled in Firmware / OS / Connected: | 2/2/1 |
| Network Speed (Mbit): | 1000 |
| Keyboard: | None |
| Mouse: | None |
| Monitor: | None |
| Optical Drives: | No |
| Other Hardware: | None |
| Software | |
|---|---|
| Power Management: | Balanced Mode enabled in OS (see SUT Notes) |
| Operating System (OS): | Microsoft Windows Server 2012 R2 Datacenter |
| OS Version: | Version 6.3 (Build 9600) |
| Filesystem: | NTFS |
| JVM Vendor: | Oracle Corporation |
| JVM Version: | Java HotSpot(TM) 64-Bit Server VM (build 24.80-b11, mixed mode), version 1.7.0_80 |
| JVM Command-line Options: | -server -Xmn19g -Xms21g -Xmx21g -XX:SurvivorRatio=1 -XX:TargetSurvivorRatio=99 -XX:ParallelGCThreads=28 -XX:AllocatePrefetchDistance=256 -XX:AllocatePrefetchLines=4 -XX:LoopUnrollLimit=45 -XX:InitialTenuringThreshold=12 -XX:MaxTenuringThreshold=15 -XX:InlineSmallCode=9000 -XX:MaxInlineSize=270 -XX:FreqInlineSize=6000 -XX:+UseLargePages -XX:+UseParallelOldGC -XX:+AggressiveOpts |
| JVM Affinity: | start /NODE [0,2] /AFFINITY [0xFC0FF00FC0FF];start /NODE [1,3] /AFFINITY [0xFF03F00FF03F] |
| JVM Instances: | 4 |
| JVM Initial Heap (MB): | 21000 |
| JVM Maximum Heap (MB): | 21000 |
| JVM Address Bits: | 64 |
| Boot Firmware Version: | 2.00.25 |
| Management Firmware Version: | UIS-OM 1.00.10 |
| Workload Version: | SSJ 1.2.10 |
| Director Location: | Controller |
| Other Software: | Microsoft Windows KB3021910, clearcompressionflag.exe, KB2919355, KB2932046, KB2959977, KB2937592, KB2938439, KB2934018, KB4056898, patched to this test system in May 15, 2019 |
| JVM Instance | ssj_ops@100% |
|---|---|
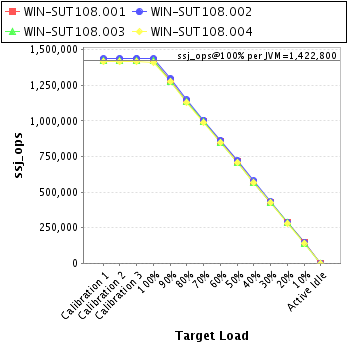
| WIN-SUT108.001 | 1,421,369 |
| WIN-SUT108.002 | 1,436,802 |
| WIN-SUT108.003 | 1,420,824 |
| WIN-SUT108.004 | 1,412,206 |
| ssj_ops@100% | 5,691,201 |
| ssj_ops@100% per JVM | 1,422,800 |
| Target Load | Actual Load | ssj_ops | |
|---|---|---|---|
| Target | Actual | ||
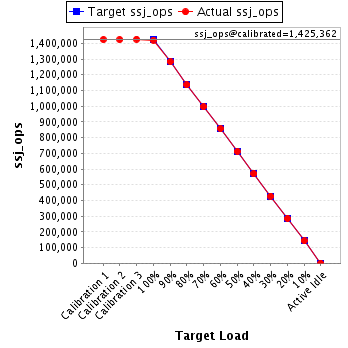
| Calibration 1 | 1,424,321 | ||
| Calibration 2 | 1,423,818 | ||
| Calibration 3 | 1,426,907 | ||
| ssj_ops@calibrated=1,425,362 | |||
| 100% | 99.7% | 1,425,362 | 1,421,369 |
| 90% | 90.0% | 1,282,826 | 1,283,035 |
| 80% | 79.7% | 1,140,290 | 1,136,150 |
| 70% | 69.9% | 997,754 | 996,677 |
| 60% | 60.1% | 855,217 | 856,414 |
| 50% | 50.0% | 712,681 | 712,488 |
| 40% | 39.9% | 570,145 | 569,409 |
| 30% | 30.0% | 427,609 | 427,950 |
| 20% | 20.0% | 285,072 | 285,193 |
| 10% | 10.0% | 142,536 | 142,743 |
| Active Idle | 0 | 0 | |
| Target Load | Actual Load | ssj_ops | |
|---|---|---|---|
| Target | Actual | ||
| Calibration 1 | 1,436,652 | ||
| Calibration 2 | 1,438,958 | ||
| Calibration 3 | 1,439,988 | ||
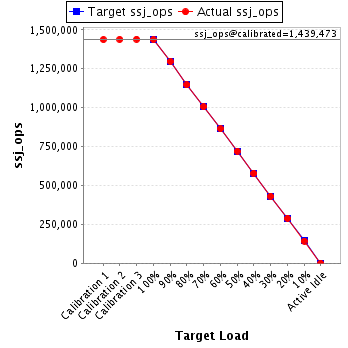
| ssj_ops@calibrated=1,439,473 | |||
| 100% | 99.8% | 1,439,473 | 1,436,802 |
| 90% | 90.1% | 1,295,526 | 1,297,035 |
| 80% | 79.7% | 1,151,578 | 1,146,663 |
| 70% | 69.9% | 1,007,631 | 1,005,611 |
| 60% | 60.0% | 863,684 | 863,320 |
| 50% | 50.1% | 719,736 | 720,834 |
| 40% | 40.1% | 575,789 | 577,670 |
| 30% | 30.0% | 431,842 | 431,749 |
| 20% | 20.1% | 287,895 | 288,871 |
| 10% | 9.9% | 143,947 | 142,842 |
| Active Idle | 0 | 0 | |
| Target Load | Actual Load | ssj_ops | |
|---|---|---|---|
| Target | Actual | ||
| Calibration 1 | 1,424,093 | ||
| Calibration 2 | 1,421,066 | ||
| Calibration 3 | 1,421,085 | ||
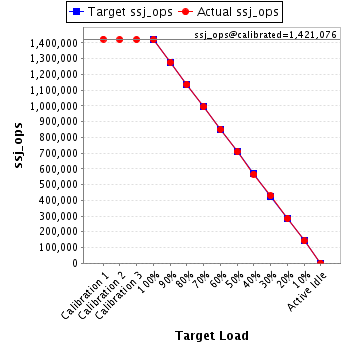
| ssj_ops@calibrated=1,421,076 | |||
| 100% | 100.0% | 1,421,076 | 1,420,824 |
| 90% | 89.9% | 1,278,968 | 1,277,794 |
| 80% | 79.9% | 1,136,861 | 1,136,140 |
| 70% | 69.9% | 994,753 | 993,781 |
| 60% | 59.9% | 852,645 | 850,975 |
| 50% | 49.9% | 710,538 | 708,618 |
| 40% | 39.9% | 568,430 | 566,668 |
| 30% | 30.2% | 426,323 | 428,617 |
| 20% | 20.0% | 284,215 | 284,194 |
| 10% | 10.0% | 142,108 | 142,208 |
| Active Idle | 0 | 0 | |
| Target Load | Actual Load | ssj_ops | |
|---|---|---|---|
| Target | Actual | ||
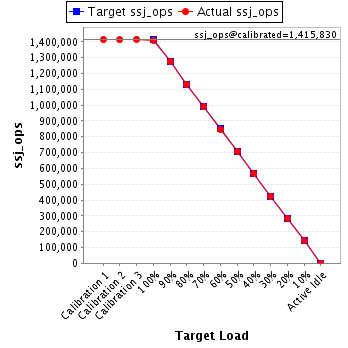
| Calibration 1 | 1,415,505 | ||
| Calibration 2 | 1,413,976 | ||
| Calibration 3 | 1,417,684 | ||
| ssj_ops@calibrated=1,415,830 | |||
| 100% | 99.7% | 1,415,830 | 1,412,206 |
| 90% | 90.1% | 1,274,247 | 1,276,176 |
| 80% | 79.9% | 1,132,664 | 1,130,834 |
| 70% | 69.8% | 991,081 | 988,721 |
| 60% | 59.9% | 849,498 | 848,773 |
| 50% | 50.0% | 707,915 | 707,373 |
| 40% | 39.9% | 566,332 | 565,588 |
| 30% | 29.9% | 424,749 | 424,022 |
| 20% | 19.9% | 283,166 | 282,281 |
| 10% | 10.0% | 141,583 | 141,978 |
| Active Idle | 0 | 0 | |