SPECpower_ssj2008
Host 'WIN-SUT110' Performance Report
Copyright © 2007-2019 Standard Performance Evaluation Corporation
| New H3C Technologies Co., Ltd. H3C UniServer B5700 G3 | ssj_ops@100% = 5,690,830 ssj_ops@100% per JVM = 1,422,707 |
||||
| Test Sponsor: | New H3C Technologies Co., Ltd. | SPEC License #: | 9066 | Test Method: | Multi Node |
| Tested By: | New H3C Technologies Co., Ltd. | Test Location: | Hangzhou, Zhejiang, China | Test Date: | May 17, 2019 |
| Hardware Availability: | Jan-2019 | Software Availability: | Jan-2019 | Publication: | Jun 12, 2019 |
| System Source: | Single Supplier | System Designation: | Server | Power Provisioning: | Line-powered |
| Target Load | Actual Load | ssj_ops | |
|---|---|---|---|
| Target | Actual | ||
| Calibration 1 | 5,698,861 | ||
| Calibration 2 | 5,694,919 | ||
| Calibration 3 | 5,700,146 | ||
| ssj_ops@calibrated=5,697,533 | |||
| 100% | 99.9% | 5,697,533 | 5,690,830 |
| 90% | 90.0% | 5,127,779 | 5,128,053 |
| 80% | 79.9% | 4,558,026 | 4,553,220 |
| 70% | 70.1% | 3,988,273 | 3,992,019 |
| 60% | 59.7% | 3,418,520 | 3,402,215 |
| 50% | 50.1% | 2,848,766 | 2,851,716 |
| 40% | 40.0% | 2,279,013 | 2,279,728 |
| 30% | 30.0% | 1,709,260 | 1,707,011 |
| 20% | 20.0% | 1,139,507 | 1,137,692 |
| 10% | 10.0% | 569,753 | 570,338 |
| Active Idle | 0 | 0 | |

| Set Identifier: | sut |
| Set Description: | System Under Test |
| # of Identical Nodes: | 13 |
| Comment: | SUT |
| Hardware | |
|---|---|
| Hardware Vendor: | New H3C Technologies Co., Ltd. |
| Model: | H3C UniServer B5700 G3 |
| Form Factor: | Other |
| CPU Name: | Intel Xeon Platinum 8180 2.50GHz |
| CPU Characteristics: | 28-Core, 2.50 GHz, 38.5 MB L3 Cache |
| CPU Frequency (MHz): | 2500 |
| CPU(s) Enabled: | 56 cores, 2 chips, 28 cores/chip |
| Hardware Threads: | 112 (2 / core) |
| CPU(s) Orderable: | 1,2 chips |
| Primary Cache: | 32 KB I + 32 KB D on chip per core |
| Secondary Cache: | 1 MB I+D on chip per core |
| Tertiary Cache: | 39424 KB I+D on chip per chip |
| Other Cache: | None |
| Memory Amount (GB): | 192.0 |
| # and size of DIMM: | 12 x 16384 MB |
| Memory Details: | 12 x 16GB 2Rx8 PC4-2666-V ECC;slots A1, A2, A3, A4, A5, A6, B1, B2, B3, B4, B5, B6 populated |
| Power Supply Quantity and Rating (W): | None |
| Power Supply Details: | Shared |
| Disk Drive: | SATA DOM 128GB P/N DESSH-A28D09BCADCA |
| Disk Controller: | Integrated SATA controller |
| # and type of Network Interface Cards (NICs) Installed: | 1 x Intel I350 Gigabit Ethernet Controller |
| NICs Enabled in Firmware / OS / Connected: | 2/2/1 |
| Network Speed (Mbit): | 1000 |
| Keyboard: | None |
| Mouse: | None |
| Monitor: | None |
| Optical Drives: | No |
| Other Hardware: | None |
| Software | |
|---|---|
| Power Management: | Balanced Mode enabled in OS (see SUT Notes) |
| Operating System (OS): | Microsoft Windows Server 2012 R2 Datacenter |
| OS Version: | Version 6.3 (Build 9600) |
| Filesystem: | NTFS |
| JVM Vendor: | Oracle Corporation |
| JVM Version: | Java HotSpot(TM) 64-Bit Server VM (build 24.80-b11, mixed mode), version 1.7.0_80 |
| JVM Command-line Options: | -server -Xmn19g -Xms21g -Xmx21g -XX:SurvivorRatio=1 -XX:TargetSurvivorRatio=99 -XX:ParallelGCThreads=28 -XX:AllocatePrefetchDistance=256 -XX:AllocatePrefetchLines=4 -XX:LoopUnrollLimit=45 -XX:InitialTenuringThreshold=12 -XX:MaxTenuringThreshold=15 -XX:InlineSmallCode=9000 -XX:MaxInlineSize=270 -XX:FreqInlineSize=6000 -XX:+UseLargePages -XX:+UseParallelOldGC -XX:+AggressiveOpts |
| JVM Affinity: | start /NODE [0,2] /AFFINITY [0xFC0FF00FC0FF];start /NODE [1,3] /AFFINITY [0xFF03F00FF03F] |
| JVM Instances: | 4 |
| JVM Initial Heap (MB): | 21000 |
| JVM Maximum Heap (MB): | 21000 |
| JVM Address Bits: | 64 |
| Boot Firmware Version: | 2.00.25 |
| Management Firmware Version: | UIS-OM 1.00.10 |
| Workload Version: | SSJ 1.2.10 |
| Director Location: | Controller |
| Other Software: | Microsoft Windows KB3021910, clearcompressionflag.exe, KB2919355, KB2932046, KB2959977, KB2937592, KB2938439, KB2934018, KB4056898, patched to this test system in May 15, 2019 |
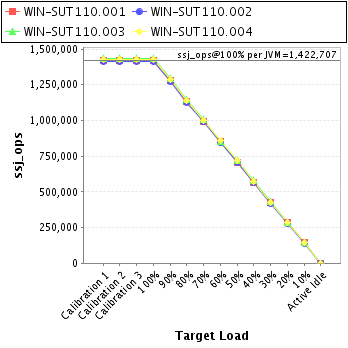
| JVM Instance | ssj_ops@100% |
|---|---|
| WIN-SUT110.001 | 1,417,574 |
| WIN-SUT110.002 | 1,413,537 |
| WIN-SUT110.003 | 1,433,248 |
| WIN-SUT110.004 | 1,426,470 |
| ssj_ops@100% | 5,690,830 |
| ssj_ops@100% per JVM | 1,422,707 |
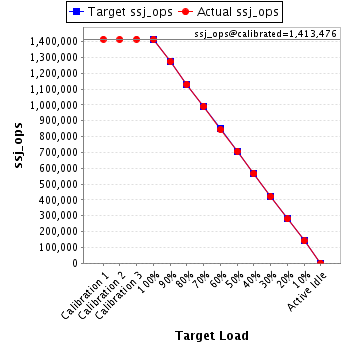
| Target Load | Actual Load | ssj_ops | |
|---|---|---|---|
| Target | Actual | ||
| Calibration 1 | 1,420,121 | ||
| Calibration 2 | 1,417,214 | ||
| Calibration 3 | 1,422,382 | ||
| ssj_ops@calibrated=1,419,798 | |||
| 100% | 99.8% | 1,419,798 | 1,417,574 |
| 90% | 90.0% | 1,277,818 | 1,277,496 |
| 80% | 80.0% | 1,135,839 | 1,136,244 |
| 70% | 70.1% | 993,859 | 995,196 |
| 60% | 59.9% | 851,879 | 849,996 |
| 50% | 49.9% | 709,899 | 707,973 |
| 40% | 39.8% | 567,919 | 564,890 |
| 30% | 30.0% | 425,939 | 426,365 |
| 20% | 20.1% | 283,960 | 285,591 |
| 10% | 10.0% | 141,980 | 142,670 |
| Active Idle | 0 | 0 | |
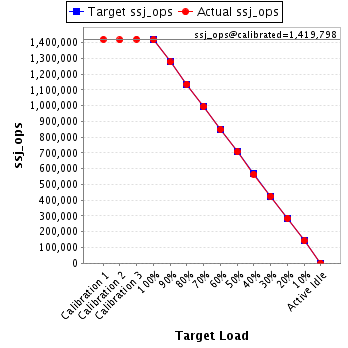
| Target Load | Actual Load | ssj_ops | |
|---|---|---|---|
| Target | Actual | ||
| Calibration 1 | 1,414,140 | ||
| Calibration 2 | 1,412,293 | ||
| Calibration 3 | 1,414,660 | ||
| ssj_ops@calibrated=1,413,476 | |||
| 100% | 100.0% | 1,413,476 | 1,413,537 |
| 90% | 90.1% | 1,272,129 | 1,272,948 |
| 80% | 79.9% | 1,130,781 | 1,128,714 |
| 70% | 70.1% | 989,433 | 991,162 |
| 60% | 59.7% | 848,086 | 843,608 |
| 50% | 50.0% | 706,738 | 706,656 |
| 40% | 40.0% | 565,391 | 565,266 |
| 30% | 29.8% | 424,043 | 421,546 |
| 20% | 19.8% | 282,695 | 279,692 |
| 10% | 10.0% | 141,348 | 141,566 |
| Active Idle | 0 | 0 | |
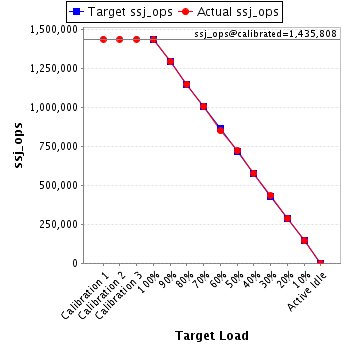
| Target Load | Actual Load | ssj_ops | |
|---|---|---|---|
| Target | Actual | ||
| Calibration 1 | 1,435,538 | ||
| Calibration 2 | 1,435,452 | ||
| Calibration 3 | 1,436,165 | ||
| ssj_ops@calibrated=1,435,808 | |||
| 100% | 99.8% | 1,435,808 | 1,433,248 |
| 90% | 90.0% | 1,292,228 | 1,292,516 |
| 80% | 80.0% | 1,148,647 | 1,148,003 |
| 70% | 70.1% | 1,005,066 | 1,006,153 |
| 60% | 59.2% | 861,485 | 849,503 |
| 50% | 50.1% | 717,904 | 719,656 |
| 40% | 40.2% | 574,323 | 576,953 |
| 30% | 30.1% | 430,743 | 432,863 |
| 20% | 20.0% | 287,162 | 287,754 |
| 10% | 10.0% | 143,581 | 143,391 |
| Active Idle | 0 | 0 | |
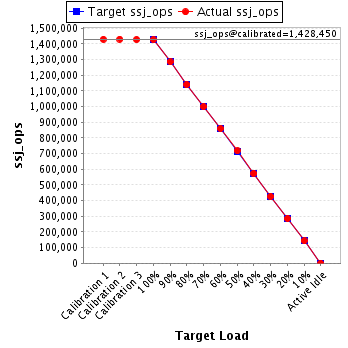
| Target Load | Actual Load | ssj_ops | |
|---|---|---|---|
| Target | Actual | ||
| Calibration 1 | 1,429,061 | ||
| Calibration 2 | 1,429,960 | ||
| Calibration 3 | 1,426,939 | ||
| ssj_ops@calibrated=1,428,450 | |||
| 100% | 99.9% | 1,428,450 | 1,426,470 |
| 90% | 90.0% | 1,285,605 | 1,285,094 |
| 80% | 79.8% | 1,142,760 | 1,140,259 |
| 70% | 70.0% | 999,915 | 999,507 |
| 60% | 60.1% | 857,070 | 859,109 |
| 50% | 50.2% | 714,225 | 717,432 |
| 40% | 40.1% | 571,380 | 572,620 |
| 30% | 29.8% | 428,535 | 426,237 |
| 20% | 19.9% | 285,690 | 284,655 |
| 10% | 10.0% | 142,845 | 142,711 |
| Active Idle | 0 | 0 | |