SPECpower_ssj2008
Host 'WIN-SUT113' Performance Report
Copyright © 2007-2019 Standard Performance Evaluation Corporation
| New H3C Technologies Co., Ltd. H3C UniServer B5700 G3 | ssj_ops@100% = 5,706,990 ssj_ops@100% per JVM = 1,426,748 |
||||
| Test Sponsor: | New H3C Technologies Co., Ltd. | SPEC License #: | 9066 | Test Method: | Multi Node |
| Tested By: | New H3C Technologies Co., Ltd. | Test Location: | Hangzhou, Zhejiang, China | Test Date: | May 17, 2019 |
| Hardware Availability: | Jan-2019 | Software Availability: | Jan-2019 | Publication: | Jun 12, 2019 |
| System Source: | Single Supplier | System Designation: | Server | Power Provisioning: | Line-powered |
| Target Load | Actual Load | ssj_ops | |
|---|---|---|---|
| Target | Actual | ||
| Calibration 1 | 5,708,983 | ||
| Calibration 2 | 5,708,791 | ||
| Calibration 3 | 5,715,049 | ||
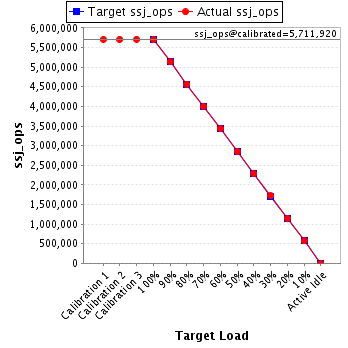
| ssj_ops@calibrated=5,711,920 | |||
| 100% | 99.9% | 5,711,920 | 5,706,990 |
| 90% | 89.9% | 5,140,728 | 5,133,878 |
| 80% | 80.0% | 4,569,536 | 4,570,693 |
| 70% | 70.0% | 3,998,344 | 4,000,762 |
| 60% | 60.2% | 3,427,152 | 3,438,981 |
| 50% | 50.0% | 2,855,960 | 2,854,330 |
| 40% | 40.0% | 2,284,768 | 2,283,107 |
| 30% | 30.1% | 1,713,576 | 1,716,473 |
| 20% | 20.0% | 1,142,384 | 1,143,086 |
| 10% | 10.0% | 571,192 | 570,202 |
| Active Idle | 0 | 0 | |
| Set Identifier: | sut |
| Set Description: | System Under Test |
| # of Identical Nodes: | 13 |
| Comment: | SUT |
| Hardware | |
|---|---|
| Hardware Vendor: | New H3C Technologies Co., Ltd. |
| Model: | H3C UniServer B5700 G3 |
| Form Factor: | Other |
| CPU Name: | Intel Xeon Platinum 8180 2.50GHz |
| CPU Characteristics: | 28-Core, 2.50 GHz, 38.5 MB L3 Cache |
| CPU Frequency (MHz): | 2500 |
| CPU(s) Enabled: | 56 cores, 2 chips, 28 cores/chip |
| Hardware Threads: | 112 (2 / core) |
| CPU(s) Orderable: | 1,2 chips |
| Primary Cache: | 32 KB I + 32 KB D on chip per core |
| Secondary Cache: | 1 MB I+D on chip per core |
| Tertiary Cache: | 39424 KB I+D on chip per chip |
| Other Cache: | None |
| Memory Amount (GB): | 192.0 |
| # and size of DIMM: | 12 x 16384 MB |
| Memory Details: | 12 x 16GB 2Rx8 PC4-2666-V ECC;slots A1, A2, A3, A4, A5, A6, B1, B2, B3, B4, B5, B6 populated |
| Power Supply Quantity and Rating (W): | None |
| Power Supply Details: | Shared |
| Disk Drive: | SATA DOM 128GB P/N DESSH-A28D09BCADCA |
| Disk Controller: | Integrated SATA controller |
| # and type of Network Interface Cards (NICs) Installed: | 1 x Intel I350 Gigabit Ethernet Controller |
| NICs Enabled in Firmware / OS / Connected: | 2/2/1 |
| Network Speed (Mbit): | 1000 |
| Keyboard: | None |
| Mouse: | None |
| Monitor: | None |
| Optical Drives: | No |
| Other Hardware: | None |
| Software | |
|---|---|
| Power Management: | Balanced Mode enabled in OS (see SUT Notes) |
| Operating System (OS): | Microsoft Windows Server 2012 R2 Datacenter |
| OS Version: | Version 6.3 (Build 9600) |
| Filesystem: | NTFS |
| JVM Vendor: | Oracle Corporation |
| JVM Version: | Java HotSpot(TM) 64-Bit Server VM (build 24.80-b11, mixed mode), version 1.7.0_80 |
| JVM Command-line Options: | -server -Xmn19g -Xms21g -Xmx21g -XX:SurvivorRatio=1 -XX:TargetSurvivorRatio=99 -XX:ParallelGCThreads=28 -XX:AllocatePrefetchDistance=256 -XX:AllocatePrefetchLines=4 -XX:LoopUnrollLimit=45 -XX:InitialTenuringThreshold=12 -XX:MaxTenuringThreshold=15 -XX:InlineSmallCode=9000 -XX:MaxInlineSize=270 -XX:FreqInlineSize=6000 -XX:+UseLargePages -XX:+UseParallelOldGC -XX:+AggressiveOpts |
| JVM Affinity: | start /NODE [0,2] /AFFINITY [0xFC0FF00FC0FF];start /NODE [1,3] /AFFINITY [0xFF03F00FF03F] |
| JVM Instances: | 4 |
| JVM Initial Heap (MB): | 21000 |
| JVM Maximum Heap (MB): | 21000 |
| JVM Address Bits: | 64 |
| Boot Firmware Version: | 2.00.25 |
| Management Firmware Version: | UIS-OM 1.00.10 |
| Workload Version: | SSJ 1.2.10 |
| Director Location: | Controller |
| Other Software: | Microsoft Windows KB3021910, clearcompressionflag.exe, KB2919355, KB2932046, KB2959977, KB2937592, KB2938439, KB2934018, KB4056898, patched to this test system in May 15, 2019 |
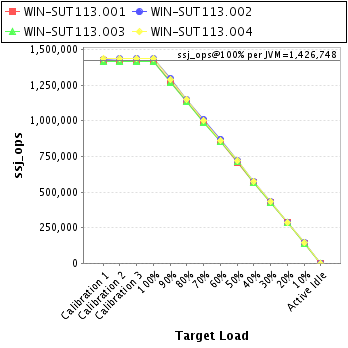
| JVM Instance | ssj_ops@100% |
|---|---|
| WIN-SUT113.001 | 1,419,146 |
| WIN-SUT113.002 | 1,437,640 |
| WIN-SUT113.003 | 1,414,808 |
| WIN-SUT113.004 | 1,435,396 |
| ssj_ops@100% | 5,706,990 |
| ssj_ops@100% per JVM | 1,426,748 |
| Target Load | Actual Load | ssj_ops | |
|---|---|---|---|
| Target | Actual | ||
| Calibration 1 | 1,423,435 | ||
| Calibration 2 | 1,420,539 | ||
| Calibration 3 | 1,421,771 | ||
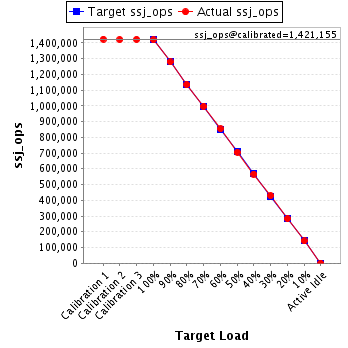
| ssj_ops@calibrated=1,421,155 | |||
| 100% | 99.9% | 1,421,155 | 1,419,146 |
| 90% | 90.0% | 1,279,040 | 1,278,600 |
| 80% | 79.8% | 1,136,924 | 1,134,355 |
| 70% | 70.2% | 994,809 | 998,196 |
| 60% | 60.1% | 852,693 | 853,630 |
| 50% | 49.7% | 710,578 | 705,991 |
| 40% | 39.9% | 568,462 | 566,850 |
| 30% | 30.2% | 426,347 | 428,696 |
| 20% | 19.9% | 284,231 | 282,826 |
| 10% | 10.0% | 142,116 | 141,801 |
| Active Idle | 0 | 0 | |
| Target Load | Actual Load | ssj_ops | |
|---|---|---|---|
| Target | Actual | ||
| Calibration 1 | 1,433,145 | ||
| Calibration 2 | 1,436,235 | ||
| Calibration 3 | 1,439,603 | ||
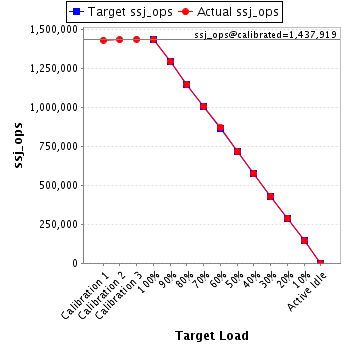
| ssj_ops@calibrated=1,437,919 | |||
| 100% | 100.0% | 1,437,919 | 1,437,640 |
| 90% | 90.1% | 1,294,127 | 1,296,019 |
| 80% | 80.0% | 1,150,335 | 1,150,501 |
| 70% | 70.2% | 1,006,543 | 1,009,309 |
| 60% | 60.6% | 862,751 | 871,296 |
| 50% | 50.0% | 718,959 | 718,564 |
| 40% | 40.0% | 575,168 | 575,129 |
| 30% | 30.0% | 431,376 | 431,820 |
| 20% | 20.0% | 287,584 | 287,832 |
| 10% | 10.0% | 143,792 | 143,893 |
| Active Idle | 0 | 0 | |
| Target Load | Actual Load | ssj_ops | |
|---|---|---|---|
| Target | Actual | ||
| Calibration 1 | 1,417,125 | ||
| Calibration 2 | 1,417,213 | ||
| Calibration 3 | 1,418,281 | ||
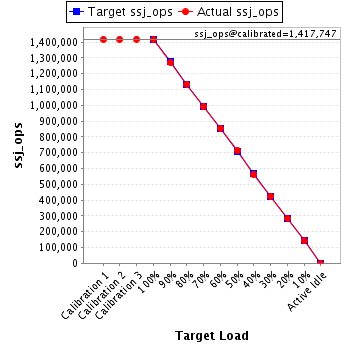
| ssj_ops@calibrated=1,417,747 | |||
| 100% | 99.8% | 1,417,747 | 1,414,808 |
| 90% | 89.6% | 1,275,973 | 1,270,863 |
| 80% | 80.0% | 1,134,198 | 1,133,506 |
| 70% | 69.8% | 992,423 | 989,888 |
| 60% | 60.2% | 850,648 | 853,400 |
| 50% | 50.2% | 708,874 | 711,917 |
| 40% | 39.8% | 567,099 | 564,359 |
| 30% | 30.0% | 425,324 | 424,841 |
| 20% | 20.0% | 283,549 | 284,009 |
| 10% | 10.0% | 141,775 | 141,580 |
| Active Idle | 0 | 0 | |
| Target Load | Actual Load | ssj_ops | |
|---|---|---|---|
| Target | Actual | ||
| Calibration 1 | 1,435,278 | ||
| Calibration 2 | 1,434,804 | ||
| Calibration 3 | 1,435,394 | ||
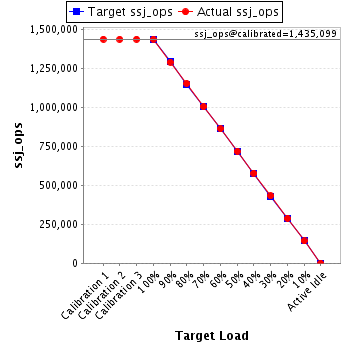
| ssj_ops@calibrated=1,435,099 | |||
| 100% | 100.0% | 1,435,099 | 1,435,396 |
| 90% | 89.8% | 1,291,589 | 1,288,396 |
| 80% | 80.3% | 1,148,079 | 1,152,330 |
| 70% | 69.9% | 1,004,569 | 1,003,370 |
| 60% | 60.0% | 861,059 | 860,655 |
| 50% | 50.0% | 717,549 | 717,858 |
| 40% | 40.2% | 574,040 | 576,769 |
| 30% | 30.0% | 430,530 | 431,116 |
| 20% | 20.1% | 287,020 | 288,419 |
| 10% | 10.0% | 143,510 | 142,928 |
| Active Idle | 0 | 0 | |