
SPECpower_ssj2008
Host 'WIN-SUT112' Performance Report
Copyright © 2007-2019 Standard Performance Evaluation Corporation
| New H3C Technologies Co., Ltd. H3C UniServer B5700 G3 | ssj_ops@100% = 5,711,457 ssj_ops@100% per JVM = 1,427,864 |
||||
| Test Sponsor: | New H3C Technologies Co., Ltd. | SPEC License #: | 9066 | Test Method: | Multi Node |
| Tested By: | New H3C Technologies Co., Ltd. | Test Location: | Hangzhou, Zhejiang, China | Test Date: | May 17, 2019 |
| Hardware Availability: | Jan-2019 | Software Availability: | Jan-2019 | Publication: | Jun 12, 2019 |
| System Source: | Single Supplier | System Designation: | Server | Power Provisioning: | Line-powered |
| Target Load | Actual Load | ssj_ops | |
|---|---|---|---|
| Target | Actual | ||
| Calibration 1 | 5,724,310 | ||
| Calibration 2 | 5,714,294 | ||
| Calibration 3 | 5,721,606 | ||
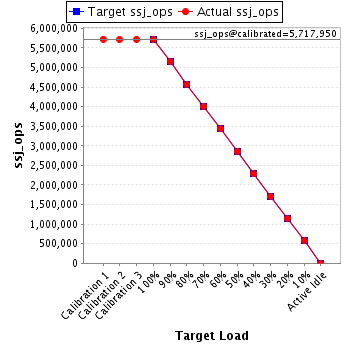
| ssj_ops@calibrated=5,717,950 | |||
| 100% | 99.9% | 5,717,950 | 5,711,457 |
| 90% | 90.1% | 5,146,155 | 5,149,030 |
| 80% | 80.0% | 4,574,360 | 4,574,207 |
| 70% | 70.1% | 4,002,565 | 4,006,708 |
| 60% | 60.0% | 3,430,770 | 3,432,429 |
| 50% | 49.9% | 2,858,975 | 2,854,671 |
| 40% | 39.9% | 2,287,180 | 2,282,435 |
| 30% | 30.0% | 1,715,385 | 1,713,208 |
| 20% | 20.0% | 1,143,590 | 1,142,529 |
| 10% | 10.0% | 571,795 | 573,797 |
| Active Idle | 0 | 0 | |
| Set Identifier: | sut |
| Set Description: | System Under Test |
| # of Identical Nodes: | 14 |
| Comment: | SUT |
| Hardware | |
|---|---|
| Hardware Vendor: | New H3C Technologies Co., Ltd. |
| Model: | H3C UniServer B5700 G3 |
| Form Factor: | Other |
| CPU Name: | Intel Xeon Platinum 8180 2.50GHz |
| CPU Characteristics: | 28-Core, 2.50 GHz, 38.5 MB L3 Cache |
| CPU Frequency (MHz): | 2500 |
| CPU(s) Enabled: | 56 cores, 2 chips, 28 cores/chip |
| Hardware Threads: | 112 (2 / core) |
| CPU(s) Orderable: | 1,2 chips |
| Primary Cache: | 32 KB I + 32 KB D on chip per core |
| Secondary Cache: | 1 MB I+D on chip per core |
| Tertiary Cache: | 39424 KB I+D on chip per chip |
| Other Cache: | None |
| Memory Amount (GB): | 192.0 |
| # and size of DIMM: | 12 x 16384 MB |
| Memory Details: | 12 x 16GB 2Rx8 PC4-2666-V ECC;slots A1, A2, A3, A4, A5, A6, B1, B2, B3, B4, B5, B6 populated |
| Power Supply Quantity and Rating (W): | None |
| Power Supply Details: | Shared |
| Disk Drive: | SATA DOM 128GB P/N DESSH-A28D09BCADCA |
| Disk Controller: | Integrated SATA controller |
| # and type of Network Interface Cards (NICs) Installed: | 1 x Intel I350 Gigabit Ethernet Controller |
| NICs Enabled in Firmware / OS / Connected: | 2/2/1 |
| Network Speed (Mbit): | 1000 |
| Keyboard: | None |
| Mouse: | None |
| Monitor: | None |
| Optical Drives: | No |
| Other Hardware: | None |
| Software | |
|---|---|
| Power Management: | Balanced Mode enabled in OS (see SUT Notes) |
| Operating System (OS): | Microsoft Windows Server 2012 R2 Datacenter |
| OS Version: | Version 6.3 (Build 9600) |
| Filesystem: | NTFS |
| JVM Vendor: | Oracle Corporation |
| JVM Version: | Java HotSpot(TM) 64-Bit Server VM (build 24.80-b11, mixed mode), version 1.7.0_80 |
| JVM Command-line Options: | -server -Xmn19g -Xms21g -Xmx21g -XX:SurvivorRatio=1 -XX:TargetSurvivorRatio=99 -XX:ParallelGCThreads=28 -XX:AllocatePrefetchDistance=256 -XX:AllocatePrefetchLines=4 -XX:LoopUnrollLimit=45 -XX:InitialTenuringThreshold=12 -XX:MaxTenuringThreshold=15 -XX:InlineSmallCode=9000 -XX:MaxInlineSize=270 -XX:FreqInlineSize=6000 -XX:+UseLargePages -XX:+UseParallelOldGC -XX:+AggressiveOpts |
| JVM Affinity: | start /NODE [0,2] /AFFINITY [0xFC0FF00FC0FF];start /NODE [1,3] /AFFINITY [0xFF03F00FF03F] |
| JVM Instances: | 4 |
| JVM Initial Heap (MB): | 21000 |
| JVM Maximum Heap (MB): | 21000 |
| JVM Address Bits: | 64 |
| Boot Firmware Version: | 2.00.25 |
| Management Firmware Version: | UIS-OM 1.00.10 |
| Workload Version: | SSJ 1.2.10 |
| Director Location: | Controller |
| Other Software: | Microsoft Windows KB3021910, clearcompressionflag.exe, KB2919355, KB2932046, KB2959977, KB2937592, KB2938439, KB2934018, KB4056898, patched to this test system in May 15, 2019 |
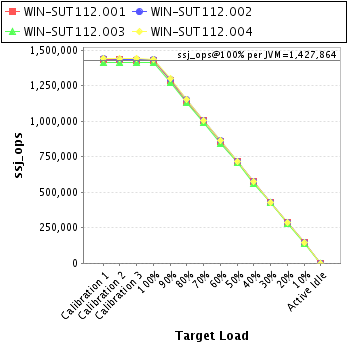
| JVM Instance | ssj_ops@100% |
|---|---|
| WIN-SUT112.001 | 1,428,917 |
| WIN-SUT112.002 | 1,435,128 |
| WIN-SUT112.003 | 1,410,619 |
| WIN-SUT112.004 | 1,436,792 |
| ssj_ops@100% | 5,711,457 |
| ssj_ops@100% per JVM | 1,427,864 |
| Target Load | Actual Load | ssj_ops | |
|---|---|---|---|
| Target | Actual | ||
| Calibration 1 | 1,432,127 | ||
| Calibration 2 | 1,430,062 | ||
| Calibration 3 | 1,427,949 | ||
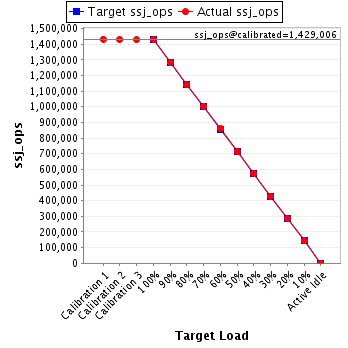
| ssj_ops@calibrated=1,429,006 | |||
| 100% | 100.0% | 1,429,006 | 1,428,917 |
| 90% | 89.9% | 1,286,105 | 1,284,102 |
| 80% | 79.7% | 1,143,204 | 1,139,493 |
| 70% | 70.1% | 1,000,304 | 1,002,346 |
| 60% | 60.2% | 857,403 | 859,747 |
| 50% | 49.9% | 714,503 | 713,078 |
| 40% | 40.0% | 571,602 | 572,011 |
| 30% | 30.0% | 428,702 | 428,413 |
| 20% | 19.9% | 285,801 | 284,211 |
| 10% | 10.1% | 142,901 | 143,905 |
| Active Idle | 0 | 0 | |
| Target Load | Actual Load | ssj_ops | |
|---|---|---|---|
| Target | Actual | ||
| Calibration 1 | 1,437,474 | ||
| Calibration 2 | 1,435,395 | ||
| Calibration 3 | 1,435,440 | ||
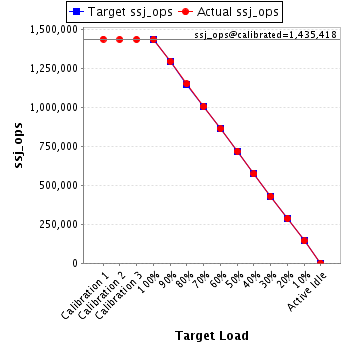
| ssj_ops@calibrated=1,435,418 | |||
| 100% | 100.0% | 1,435,418 | 1,435,128 |
| 90% | 90.2% | 1,291,876 | 1,295,087 |
| 80% | 80.2% | 1,148,334 | 1,150,545 |
| 70% | 70.1% | 1,004,792 | 1,006,102 |
| 60% | 60.1% | 861,251 | 862,352 |
| 50% | 50.0% | 717,709 | 718,294 |
| 40% | 39.9% | 574,167 | 572,749 |
| 30% | 29.9% | 430,625 | 429,691 |
| 20% | 20.0% | 287,084 | 287,423 |
| 10% | 10.0% | 143,542 | 143,937 |
| Active Idle | 0 | 0 | |
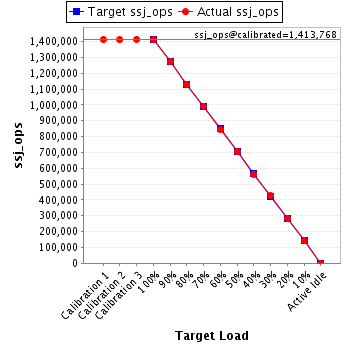
| Target Load | Actual Load | ssj_ops | |
|---|---|---|---|
| Target | Actual | ||
| Calibration 1 | 1,412,788 | ||
| Calibration 2 | 1,411,941 | ||
| Calibration 3 | 1,415,596 | ||
| ssj_ops@calibrated=1,413,768 | |||
| 100% | 99.8% | 1,413,768 | 1,410,619 |
| 90% | 90.0% | 1,272,391 | 1,271,720 |
| 80% | 80.0% | 1,131,015 | 1,130,415 |
| 70% | 70.2% | 989,638 | 992,517 |
| 60% | 59.8% | 848,261 | 844,781 |
| 50% | 49.9% | 706,884 | 705,410 |
| 40% | 39.8% | 565,507 | 563,225 |
| 30% | 30.1% | 424,130 | 424,925 |
| 20% | 20.0% | 282,754 | 282,267 |
| 10% | 10.0% | 141,377 | 141,968 |
| Active Idle | 0 | 0 | |
| Target Load | Actual Load | ssj_ops | |
|---|---|---|---|
| Target | Actual | ||
| Calibration 1 | 1,441,922 | ||
| Calibration 2 | 1,436,896 | ||
| Calibration 3 | 1,442,621 | ||
| ssj_ops@calibrated=1,439,758 | |||
| 100% | 99.8% | 1,439,758 | 1,436,792 |
| 90% | 90.2% | 1,295,782 | 1,298,120 |
| 80% | 80.1% | 1,151,807 | 1,153,753 |
| 70% | 69.9% | 1,007,831 | 1,005,743 |
| 60% | 60.1% | 863,855 | 865,548 |
| 50% | 49.9% | 719,879 | 717,887 |
| 40% | 39.9% | 575,903 | 574,451 |
| 30% | 29.9% | 431,927 | 430,179 |
| 20% | 20.0% | 287,952 | 288,628 |
| 10% | 10.0% | 143,976 | 143,987 |
| Active Idle | 0 | 0 | |
