SPECpower_ssj2008
Host 'WIN-SUT115' Performance Report
Copyright © 2007-2019 Standard Performance Evaluation Corporation
| New H3C Technologies Co., Ltd. H3C UniServer B5700 G3 | ssj_ops@100% = 5,701,276 ssj_ops@100% per JVM = 1,425,319 |
||||
| Test Sponsor: | New H3C Technologies Co., Ltd. | SPEC License #: | 9066 | Test Method: | Multi Node |
| Tested By: | New H3C Technologies Co., Ltd. | Test Location: | Hangzhou, Zhejiang, China | Test Date: | May 23, 2019 |
| Hardware Availability: | Jan-2019 | Software Availability: | Jan-2019 | Publication: | Jun 26, 2019 |
| System Source: | Single Supplier | System Designation: | Server | Power Provisioning: | Line-powered |
| Target Load | Actual Load | ssj_ops | |
|---|---|---|---|
| Target | Actual | ||
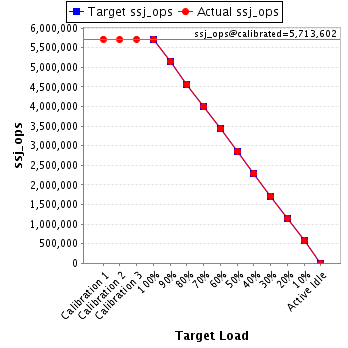
| Calibration 1 | 5,716,969 | ||
| Calibration 2 | 5,709,729 | ||
| Calibration 3 | 5,717,476 | ||
| ssj_ops@calibrated=5,713,602 | |||
| 100% | 99.8% | 5,713,602 | 5,701,276 |
| 90% | 90.1% | 5,142,242 | 5,146,392 |
| 80% | 80.0% | 4,570,882 | 4,569,025 |
| 70% | 70.1% | 3,999,522 | 4,003,282 |
| 60% | 60.1% | 3,428,161 | 3,432,116 |
| 50% | 50.1% | 2,856,801 | 2,860,173 |
| 40% | 40.1% | 2,285,441 | 2,291,589 |
| 30% | 30.0% | 1,714,081 | 1,715,590 |
| 20% | 20.0% | 1,142,720 | 1,140,871 |
| 10% | 10.0% | 571,360 | 570,656 |
| Active Idle | 0 | 0 | |
| Set Identifier: | sut |
| Set Description: | System Under Test |
| # of Identical Nodes: | 15 |
| Comment: | SUT |
| Hardware | |
|---|---|
| Hardware Vendor: | New H3C Technologies Co., Ltd. |
| Model: | H3C UniServer B5700 G3 |
| Form Factor: | other |
| CPU Name: | Intel Xeon Platinum 8180 2.50GHz |
| CPU Characteristics: | 28-Core, 2.50 GHz, 38.5 MB L3 Cache |
| CPU Frequency (MHz): | 2500 |
| CPU(s) Enabled: | 56 cores, 2 chips, 28 cores/chip |
| Hardware Threads: | 112 (2 / core) |
| CPU(s) Orderable: | 1,2 chips |
| Primary Cache: | 32 KB I + 32 KB D on chip per core |
| Secondary Cache: | 1 MB I+D on chip per core |
| Tertiary Cache: | 39424 KB I+D on chip per chip |
| Other Cache: | None |
| Memory Amount (GB): | 192.0 |
| # and size of DIMM: | 12 x 16384 MB |
| Memory Details: | 12 x 16GB 2Rx8 PC4-2666-V ECC;slots A1, A2, A3, A4, A5, A6, B1, B2, B3, B4, B5, B6 populated |
| Power Supply Quantity and Rating (W): | None |
| Power Supply Details: | Shared |
| Disk Drive: | SATA DOM 128GB P/N DESSH-A28D09BCADCA |
| Disk Controller: | Integrated SATA controller |
| # and type of Network Interface Cards (NICs) Installed: | 1 x Intel I350 Gigabit Ethernet Controller |
| NICs Enabled in Firmware / OS / Connected: | 2/2/1 |
| Network Speed (Mbit): | 1000 |
| Keyboard: | None |
| Mouse: | None |
| Monitor: | None |
| Optical Drives: | No |
| Other Hardware: | None |
| Software | |
|---|---|
| Power Management: | Balanced Mode enabled in OS (see SUT Notes) |
| Operating System (OS): | Microsoft Windows Server 2012 R2 Datacenter |
| OS Version: | Version 6.3 (Build 9600) |
| Filesystem: | NTFS |
| JVM Vendor: | Oracle Corporation |
| JVM Version: | Java HotSpot(TM) 64-Bit Server VM (build 24.80-b11, mixed mode), version 1.7.0_80 |
| JVM Command-line Options: | -server -Xmn19g -Xms21g -Xmx21g -XX:SurvivorRatio=1 -XX:TargetSurvivorRatio=99 -XX:ParallelGCThreads=28 -XX:AllocatePrefetchDistance=256 -XX:AllocatePrefetchLines=4 -XX:LoopUnrollLimit=45 -XX:InitialTenuringThreshold=12 -XX:MaxTenuringThreshold=15 -XX:InlineSmallCode=9000 -XX:MaxInlineSize=270 -XX:FreqInlineSize=6000 -XX:+UseLargePages -XX:+UseParallelOldGC -XX:+AggressiveOpts |
| JVM Affinity: | start /NODE [0,2] /AFFINITY [0xFC0FF00FC0FF];start /NODE [1,3] /AFFINITY [0xFF03F00FF03F] |
| JVM Instances: | 4 |
| JVM Initial Heap (MB): | 21000 |
| JVM Maximum Heap (MB): | 21000 |
| JVM Address Bits: | 64 |
| Boot Firmware Version: | 2.00.25 |
| Management Firmware Version: | UIS-OM 1.00.10 |
| Workload Version: | SSJ 1.2.10 |
| Director Location: | Controller |
| Other Software: | Microsoft Windows KB3021910, clearcompressionflag.exe, KB2919355, KB2932046, KB2959977, KB2937592, KB2938439, KB2934018, KB4056898, patched to this test system in May 16, 2019 |
| JVM Instance | ssj_ops@100% |
|---|---|
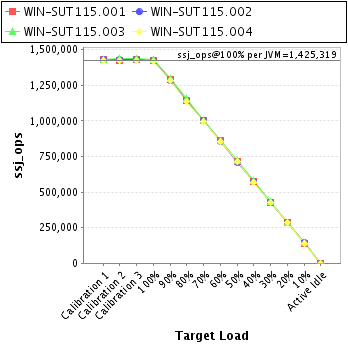
| WIN-SUT115.001 | 1,424,443 |
| WIN-SUT115.002 | 1,424,305 |
| WIN-SUT115.003 | 1,433,326 |
| WIN-SUT115.004 | 1,419,202 |
| ssj_ops@100% | 5,701,276 |
| ssj_ops@100% per JVM | 1,425,319 |
| Target Load | Actual Load | ssj_ops | |
|---|---|---|---|
| Target | Actual | ||
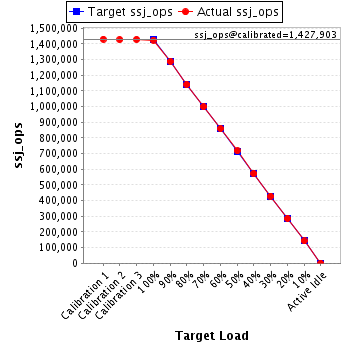
| Calibration 1 | 1,429,914 | ||
| Calibration 2 | 1,426,832 | ||
| Calibration 3 | 1,428,973 | ||
| ssj_ops@calibrated=1,427,903 | |||
| 100% | 99.8% | 1,427,903 | 1,424,443 |
| 90% | 90.2% | 1,285,112 | 1,287,846 |
| 80% | 79.9% | 1,142,322 | 1,140,531 |
| 70% | 70.0% | 999,532 | 998,941 |
| 60% | 60.1% | 856,742 | 858,783 |
| 50% | 50.2% | 713,951 | 717,247 |
| 40% | 40.0% | 571,161 | 571,585 |
| 30% | 30.0% | 428,371 | 428,967 |
| 20% | 20.0% | 285,581 | 285,303 |
| 10% | 10.0% | 142,790 | 142,096 |
| Active Idle | 0 | 0 | |
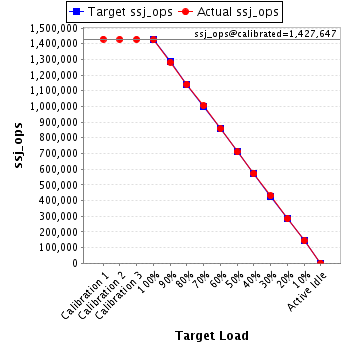
| Target Load | Actual Load | ssj_ops | |
|---|---|---|---|
| Target | Actual | ||
| Calibration 1 | 1,428,922 | ||
| Calibration 2 | 1,427,329 | ||
| Calibration 3 | 1,427,965 | ||
| ssj_ops@calibrated=1,427,647 | |||
| 100% | 99.8% | 1,427,647 | 1,424,305 |
| 90% | 89.8% | 1,284,883 | 1,281,609 |
| 80% | 79.9% | 1,142,118 | 1,140,634 |
| 70% | 70.4% | 999,353 | 1,004,922 |
| 60% | 60.1% | 856,588 | 857,928 |
| 50% | 49.8% | 713,824 | 710,256 |
| 40% | 40.0% | 571,059 | 571,186 |
| 30% | 30.1% | 428,294 | 429,880 |
| 20% | 19.9% | 285,529 | 283,546 |
| 10% | 10.1% | 142,765 | 143,952 |
| Active Idle | 0 | 0 | |
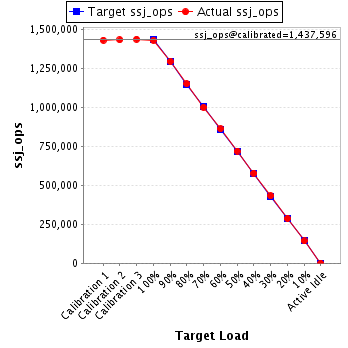
| Target Load | Actual Load | ssj_ops | |
|---|---|---|---|
| Target | Actual | ||
| Calibration 1 | 1,433,532 | ||
| Calibration 2 | 1,435,293 | ||
| Calibration 3 | 1,439,898 | ||
| ssj_ops@calibrated=1,437,596 | |||
| 100% | 99.7% | 1,437,596 | 1,433,326 |
| 90% | 90.2% | 1,293,836 | 1,297,065 |
| 80% | 80.2% | 1,150,076 | 1,153,308 |
| 70% | 69.7% | 1,006,317 | 1,002,396 |
| 60% | 60.1% | 862,557 | 863,405 |
| 50% | 50.2% | 718,798 | 721,231 |
| 40% | 40.2% | 575,038 | 578,457 |
| 30% | 30.1% | 431,279 | 432,538 |
| 20% | 19.9% | 287,519 | 286,619 |
| 10% | 10.0% | 143,760 | 143,367 |
| Active Idle | 0 | 0 | |
| Target Load | Actual Load | ssj_ops | |
|---|---|---|---|
| Target | Actual | ||
| Calibration 1 | 1,424,601 | ||
| Calibration 2 | 1,420,274 | ||
| Calibration 3 | 1,420,640 | ||
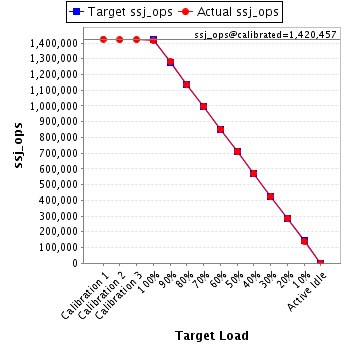
| ssj_ops@calibrated=1,420,457 | |||
| 100% | 99.9% | 1,420,457 | 1,419,202 |
| 90% | 90.1% | 1,278,411 | 1,279,872 |
| 80% | 79.9% | 1,136,366 | 1,134,551 |
| 70% | 70.2% | 994,320 | 997,022 |
| 60% | 60.0% | 852,274 | 851,999 |
| 50% | 50.1% | 710,229 | 711,440 |
| 40% | 40.2% | 568,183 | 570,363 |
| 30% | 29.9% | 426,137 | 424,205 |
| 20% | 20.1% | 284,091 | 285,404 |
| 10% | 9.9% | 142,046 | 141,240 |
| Active Idle | 0 | 0 | |