SPECpower_ssj2008
Host 'WIN-SUT101' Performance Report
Copyright © 2007-2019 Standard Performance Evaluation Corporation
| New H3C Technologies Co., Ltd. H3C UniServer B5700 G3 | ssj_ops@100% = 5,688,060 ssj_ops@100% per JVM = 1,422,015 |
||||
| Test Sponsor: | New H3C Technologies Co., Ltd. | SPEC License #: | 9066 | Test Method: | Multi Node |
| Tested By: | New H3C Technologies Co., Ltd. | Test Location: | Hangzhou, Zhejiang, China | Test Date: | May 24, 2019 |
| Hardware Availability: | Jan-2019 | Software Availability: | Jan-2019 | Publication: | Jun 26, 2019 |
| System Source: | Single Supplier | System Designation: | Server | Power Provisioning: | Line-powered |
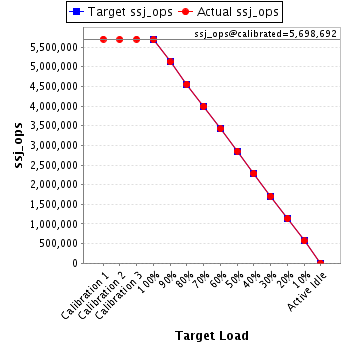
| Target Load | Actual Load | ssj_ops | |
|---|---|---|---|
| Target | Actual | ||
| Calibration 1 | 5,702,565 | ||
| Calibration 2 | 5,695,273 | ||
| Calibration 3 | 5,702,111 | ||
| ssj_ops@calibrated=5,698,692 | |||
| 100% | 99.8% | 5,698,692 | 5,688,060 |
| 90% | 89.9% | 5,128,823 | 5,124,621 |
| 80% | 79.9% | 4,558,953 | 4,554,454 |
| 70% | 70.1% | 3,989,084 | 3,994,171 |
| 60% | 60.0% | 3,419,215 | 3,419,864 |
| 50% | 50.1% | 2,849,346 | 2,853,999 |
| 40% | 40.0% | 2,279,477 | 2,281,391 |
| 30% | 30.0% | 1,709,608 | 1,708,755 |
| 20% | 20.0% | 1,139,738 | 1,138,426 |
| 10% | 10.0% | 569,869 | 569,048 |
| Active Idle | 0 | 0 | |
| Set Identifier: | sut |
| Set Description: | System Under Test |
| # of Identical Nodes: | 16 |
| Comment: | SUT |
| Hardware | |
|---|---|
| Hardware Vendor: | New H3C Technologies Co., Ltd. |
| Model: | H3C UniServer B5700 G3 |
| Form Factor: | other |
| CPU Name: | Intel Xeon Platinum 8180 2.50GHz |
| CPU Characteristics: | 28-Core, 2.50 GHz, 38.5 MB L3 Cache |
| CPU Frequency (MHz): | 2500 |
| CPU(s) Enabled: | 56 cores, 2 chips, 28 cores/chip |
| Hardware Threads: | 112 (2 / core) |
| CPU(s) Orderable: | 1,2 chips |
| Primary Cache: | 32 KB I + 32 KB D on chip per core |
| Secondary Cache: | 1 MB I+D on chip per core |
| Tertiary Cache: | 39424 KB I+D on chip per chip |
| Other Cache: | None |
| Memory Amount (GB): | 192.0 |
| # and size of DIMM: | 12 x 16384 MB |
| Memory Details: | 12 x 16GB 2Rx8 PC4-2666-V ECC;slots A1, A2, A3, A4, A5, A6, B1, B2, B3, B4, B5, B6 populated |
| Power Supply Quantity and Rating (W): | None |
| Power Supply Details: | Shared |
| Disk Drive: | SATA DOM 128GB P/N DESSH-A28D09BCADCA |
| Disk Controller: | Integrated SATA controller |
| # and type of Network Interface Cards (NICs) Installed: | 1 x Intel I350 Gigabit Ethernet Controller |
| NICs Enabled in Firmware / OS / Connected: | 2/2/1 |
| Network Speed (Mbit): | 1000 |
| Keyboard: | None |
| Mouse: | None |
| Monitor: | None |
| Optical Drives: | No |
| Other Hardware: | None |
| Software | |
|---|---|
| Power Management: | Balanced Mode enabled in OS (see SUT Notes) |
| Operating System (OS): | Microsoft Windows Server 2012 R2 Datacenter |
| OS Version: | Version 6.3 (Build 9600) |
| Filesystem: | NTFS |
| JVM Vendor: | Oracle Corporation |
| JVM Version: | Java HotSpot(TM) 64-Bit Server VM (build 24.80-b11, mixed mode), version 1.7.0_80 |
| JVM Command-line Options: | -server -Xmn19g -Xms21g -Xmx21g -XX:SurvivorRatio=1 -XX:TargetSurvivorRatio=99 -XX:ParallelGCThreads=28 -XX:AllocatePrefetchDistance=256 -XX:AllocatePrefetchLines=4 -XX:LoopUnrollLimit=45 -XX:InitialTenuringThreshold=12 -XX:MaxTenuringThreshold=15 -XX:InlineSmallCode=9000 -XX:MaxInlineSize=270 -XX:FreqInlineSize=6000 -XX:+UseLargePages -XX:+UseParallelOldGC -XX:+AggressiveOpts |
| JVM Affinity: | start /NODE [0,2] /AFFINITY [0xFC0FF00FC0FF];start /NODE [1,3] /AFFINITY [0xFF03F00FF03F] |
| JVM Instances: | 4 |
| JVM Initial Heap (MB): | 21000 |
| JVM Maximum Heap (MB): | 21000 |
| JVM Address Bits: | 64 |
| Boot Firmware Version: | 2.00.25 |
| Management Firmware Version: | UIS-OM 1.00.10 |
| Workload Version: | SSJ 1.2.10 |
| Director Location: | Controller |
| Other Software: | Microsoft Windows KB3021910, clearcompressionflag.exe, KB2919355, KB2932046, KB2959977, KB2937592, KB2938439, KB2934018, KB4056898, patched to this test system in May 16, 2019 |
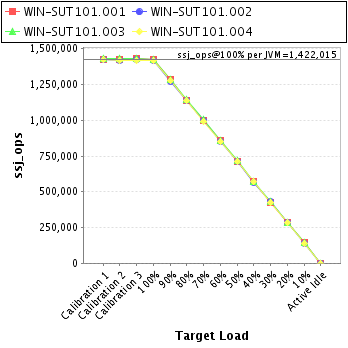
| JVM Instance | ssj_ops@100% |
|---|---|
| WIN-SUT101.001 | 1,425,534 |
| WIN-SUT101.002 | 1,416,891 |
| WIN-SUT101.003 | 1,427,960 |
| WIN-SUT101.004 | 1,417,675 |
| ssj_ops@100% | 5,688,060 |
| ssj_ops@100% per JVM | 1,422,015 |
| Target Load | Actual Load | ssj_ops | |
|---|---|---|---|
| Target | Actual | ||
| Calibration 1 | 1,423,282 | ||
| Calibration 2 | 1,425,175 | ||
| Calibration 3 | 1,428,901 | ||
| ssj_ops@calibrated=1,427,038 | |||
| 100% | 99.9% | 1,427,038 | 1,425,534 |
| 90% | 90.3% | 1,284,334 | 1,287,992 |
| 80% | 79.7% | 1,141,630 | 1,137,430 |
| 70% | 70.2% | 998,926 | 1,001,676 |
| 60% | 60.2% | 856,223 | 858,381 |
| 50% | 50.0% | 713,519 | 713,335 |
| 40% | 40.0% | 570,815 | 571,140 |
| 30% | 29.8% | 428,111 | 424,883 |
| 20% | 19.9% | 285,408 | 284,158 |
| 10% | 10.1% | 142,704 | 143,462 |
| Active Idle | 0 | 0 | |
| Target Load | Actual Load | ssj_ops | |
|---|---|---|---|
| Target | Actual | ||
| Calibration 1 | 1,423,291 | ||
| Calibration 2 | 1,417,813 | ||
| Calibration 3 | 1,421,702 | ||
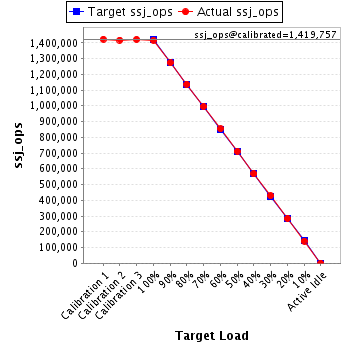
| ssj_ops@calibrated=1,419,757 | |||
| 100% | 99.8% | 1,419,757 | 1,416,891 |
| 90% | 89.7% | 1,277,782 | 1,273,441 |
| 80% | 80.1% | 1,135,806 | 1,136,944 |
| 70% | 70.2% | 993,830 | 996,351 |
| 60% | 60.1% | 851,854 | 853,846 |
| 50% | 50.1% | 709,879 | 711,449 |
| 40% | 40.0% | 567,903 | 567,763 |
| 30% | 30.2% | 425,927 | 428,552 |
| 20% | 20.0% | 283,951 | 283,930 |
| 10% | 10.0% | 141,976 | 141,320 |
| Active Idle | 0 | 0 | |
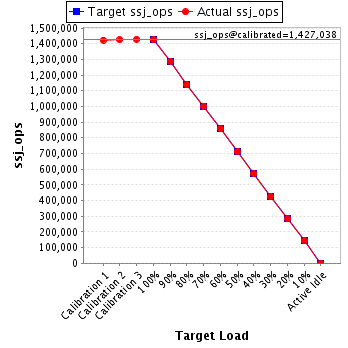
| Target Load | Actual Load | ssj_ops | |
|---|---|---|---|
| Target | Actual | ||
| Calibration 1 | 1,434,159 | ||
| Calibration 2 | 1,431,633 | ||
| Calibration 3 | 1,430,720 | ||
| ssj_ops@calibrated=1,431,177 | |||
| 100% | 99.8% | 1,431,177 | 1,427,960 |
| 90% | 89.9% | 1,288,059 | 1,286,171 |
| 80% | 79.9% | 1,144,942 | 1,143,818 |
| 70% | 70.0% | 1,001,824 | 1,002,210 |
| 60% | 59.9% | 858,706 | 857,898 |
| 50% | 50.0% | 715,588 | 716,027 |
| 40% | 40.1% | 572,471 | 573,555 |
| 30% | 30.0% | 429,353 | 429,549 |
| 20% | 20.1% | 286,235 | 287,065 |
| 10% | 10.0% | 143,118 | 143,267 |
| Active Idle | 0 | 0 | |

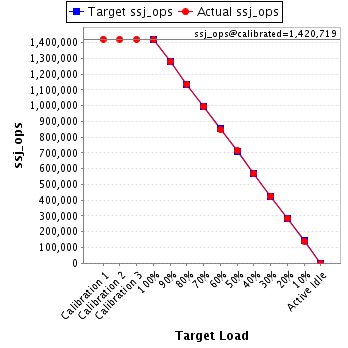
| Target Load | Actual Load | ssj_ops | |
|---|---|---|---|
| Target | Actual | ||
| Calibration 1 | 1,421,833 | ||
| Calibration 2 | 1,420,651 | ||
| Calibration 3 | 1,420,788 | ||
| ssj_ops@calibrated=1,420,719 | |||
| 100% | 99.8% | 1,420,719 | 1,417,675 |
| 90% | 89.9% | 1,278,648 | 1,277,017 |
| 80% | 80.0% | 1,136,576 | 1,136,262 |
| 70% | 70.0% | 994,504 | 993,933 |
| 60% | 59.8% | 852,432 | 849,739 |
| 50% | 50.2% | 710,360 | 713,187 |
| 40% | 40.0% | 568,288 | 568,934 |
| 30% | 30.0% | 426,216 | 425,771 |
| 20% | 19.9% | 284,144 | 283,273 |
| 10% | 9.9% | 142,072 | 140,999 |
| Active Idle | 0 | 0 | |