
SPECpower_ssj2008
Host 'WIN-SUT113' Performance Report
Copyright © 2007-2019 Standard Performance Evaluation Corporation
| New H3C Technologies Co., Ltd. H3C UniServer B5700 G3 | ssj_ops@100% = 5,675,674 ssj_ops@100% per JVM = 1,418,918 |
||||
| Test Sponsor: | New H3C Technologies Co., Ltd. | SPEC License #: | 9066 | Test Method: | Multi Node |
| Tested By: | New H3C Technologies Co., Ltd. | Test Location: | Hangzhou, Zhejiang, China | Test Date: | May 24, 2019 |
| Hardware Availability: | Jan-2019 | Software Availability: | Jan-2019 | Publication: | Jun 26, 2019 |
| System Source: | Single Supplier | System Designation: | Server | Power Provisioning: | Line-powered |
| Target Load | Actual Load | ssj_ops | |
|---|---|---|---|
| Target | Actual | ||
| Calibration 1 | 5,686,035 | ||
| Calibration 2 | 5,677,841 | ||
| Calibration 3 | 5,691,785 | ||
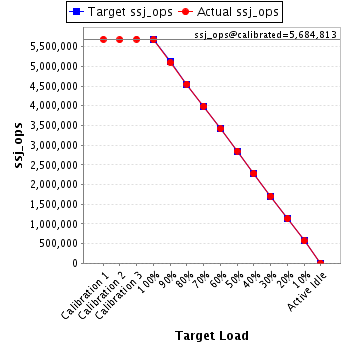
| ssj_ops@calibrated=5,684,813 | |||
| 100% | 99.8% | 5,684,813 | 5,675,674 |
| 90% | 89.6% | 5,116,332 | 5,096,344 |
| 80% | 80.0% | 4,547,851 | 4,549,264 |
| 70% | 70.2% | 3,979,369 | 3,990,626 |
| 60% | 60.0% | 3,410,888 | 3,413,245 |
| 50% | 50.1% | 2,842,407 | 2,850,834 |
| 40% | 40.0% | 2,273,925 | 2,276,527 |
| 30% | 30.0% | 1,705,444 | 1,708,137 |
| 20% | 19.9% | 1,136,963 | 1,133,589 |
| 10% | 10.0% | 568,481 | 568,259 |
| Active Idle | 0 | 0 | |
| Set Identifier: | sut |
| Set Description: | System Under Test |
| # of Identical Nodes: | 16 |
| Comment: | SUT |
| Hardware | |
|---|---|
| Hardware Vendor: | New H3C Technologies Co., Ltd. |
| Model: | H3C UniServer B5700 G3 |
| Form Factor: | other |
| CPU Name: | Intel Xeon Platinum 8180 2.50GHz |
| CPU Characteristics: | 28-Core, 2.50 GHz, 38.5 MB L3 Cache |
| CPU Frequency (MHz): | 2500 |
| CPU(s) Enabled: | 56 cores, 2 chips, 28 cores/chip |
| Hardware Threads: | 112 (2 / core) |
| CPU(s) Orderable: | 1,2 chips |
| Primary Cache: | 32 KB I + 32 KB D on chip per core |
| Secondary Cache: | 1 MB I+D on chip per core |
| Tertiary Cache: | 39424 KB I+D on chip per chip |
| Other Cache: | None |
| Memory Amount (GB): | 192.0 |
| # and size of DIMM: | 12 x 16384 MB |
| Memory Details: | 12 x 16GB 2Rx8 PC4-2666-V ECC;slots A1, A2, A3, A4, A5, A6, B1, B2, B3, B4, B5, B6 populated |
| Power Supply Quantity and Rating (W): | None |
| Power Supply Details: | Shared |
| Disk Drive: | SATA DOM 128GB P/N DESSH-A28D09BCADCA |
| Disk Controller: | Integrated SATA controller |
| # and type of Network Interface Cards (NICs) Installed: | 1 x Intel I350 Gigabit Ethernet Controller |
| NICs Enabled in Firmware / OS / Connected: | 2/2/1 |
| Network Speed (Mbit): | 1000 |
| Keyboard: | None |
| Mouse: | None |
| Monitor: | None |
| Optical Drives: | No |
| Other Hardware: | None |
| Software | |
|---|---|
| Power Management: | Balanced Mode enabled in OS (see SUT Notes) |
| Operating System (OS): | Microsoft Windows Server 2012 R2 Datacenter |
| OS Version: | Version 6.3 (Build 9600) |
| Filesystem: | NTFS |
| JVM Vendor: | Oracle Corporation |
| JVM Version: | Java HotSpot(TM) 64-Bit Server VM (build 24.80-b11, mixed mode), version 1.7.0_80 |
| JVM Command-line Options: | -server -Xmn19g -Xms21g -Xmx21g -XX:SurvivorRatio=1 -XX:TargetSurvivorRatio=99 -XX:ParallelGCThreads=28 -XX:AllocatePrefetchDistance=256 -XX:AllocatePrefetchLines=4 -XX:LoopUnrollLimit=45 -XX:InitialTenuringThreshold=12 -XX:MaxTenuringThreshold=15 -XX:InlineSmallCode=9000 -XX:MaxInlineSize=270 -XX:FreqInlineSize=6000 -XX:+UseLargePages -XX:+UseParallelOldGC -XX:+AggressiveOpts |
| JVM Affinity: | start /NODE [0,2] /AFFINITY [0xFC0FF00FC0FF];start /NODE [1,3] /AFFINITY [0xFF03F00FF03F] |
| JVM Instances: | 4 |
| JVM Initial Heap (MB): | 21000 |
| JVM Maximum Heap (MB): | 21000 |
| JVM Address Bits: | 64 |
| Boot Firmware Version: | 2.00.25 |
| Management Firmware Version: | UIS-OM 1.00.10 |
| Workload Version: | SSJ 1.2.10 |
| Director Location: | Controller |
| Other Software: | Microsoft Windows KB3021910, clearcompressionflag.exe, KB2919355, KB2932046, KB2959977, KB2937592, KB2938439, KB2934018, KB4056898, patched to this test system in May 16, 2019 |
| JVM Instance | ssj_ops@100% |
|---|---|
| WIN-SUT113.001 | 1,420,169 |
| WIN-SUT113.002 | 1,427,307 |
| WIN-SUT113.003 | 1,416,689 |
| WIN-SUT113.004 | 1,411,508 |
| ssj_ops@100% | 5,675,674 |
| ssj_ops@100% per JVM | 1,418,918 |

| Target Load | Actual Load | ssj_ops | |
|---|---|---|---|
| Target | Actual | ||
| Calibration 1 | 1,423,158 | ||
| Calibration 2 | 1,420,109 | ||
| Calibration 3 | 1,425,161 | ||
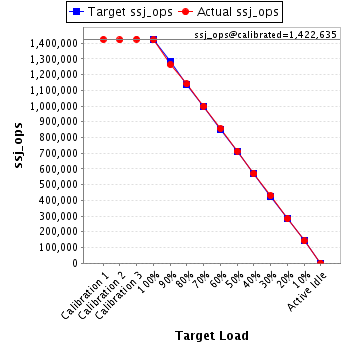
| ssj_ops@calibrated=1,422,635 | |||
| 100% | 99.8% | 1,422,635 | 1,420,169 |
| 90% | 88.8% | 1,280,372 | 1,263,228 |
| 80% | 80.2% | 1,138,108 | 1,140,297 |
| 70% | 70.3% | 995,845 | 999,705 |
| 60% | 60.2% | 853,581 | 856,315 |
| 50% | 50.1% | 711,318 | 712,925 |
| 40% | 40.0% | 569,054 | 569,194 |
| 30% | 30.2% | 426,791 | 429,605 |
| 20% | 19.9% | 284,527 | 283,449 |
| 10% | 10.0% | 142,264 | 142,325 |
| Active Idle | 0 | 0 | |
| Target Load | Actual Load | ssj_ops | |
|---|---|---|---|
| Target | Actual | ||
| Calibration 1 | 1,429,511 | ||
| Calibration 2 | 1,429,762 | ||
| Calibration 3 | 1,431,208 | ||
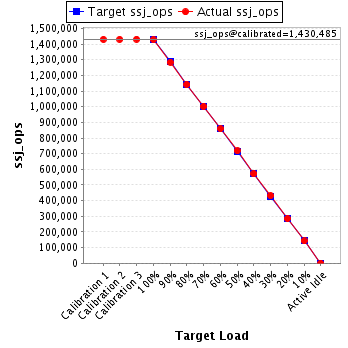
| ssj_ops@calibrated=1,430,485 | |||
| 100% | 99.8% | 1,430,485 | 1,427,307 |
| 90% | 89.7% | 1,287,437 | 1,283,762 |
| 80% | 79.8% | 1,144,388 | 1,141,459 |
| 70% | 70.1% | 1,001,340 | 1,002,991 |
| 60% | 60.0% | 858,291 | 858,236 |
| 50% | 50.2% | 715,243 | 717,423 |
| 40% | 39.9% | 572,194 | 570,698 |
| 30% | 30.2% | 429,146 | 431,371 |
| 20% | 19.9% | 286,097 | 284,546 |
| 10% | 10.0% | 143,049 | 142,521 |
| Active Idle | 0 | 0 | |
| Target Load | Actual Load | ssj_ops | |
|---|---|---|---|
| Target | Actual | ||
| Calibration 1 | 1,417,269 | ||
| Calibration 2 | 1,414,135 | ||
| Calibration 3 | 1,420,355 | ||
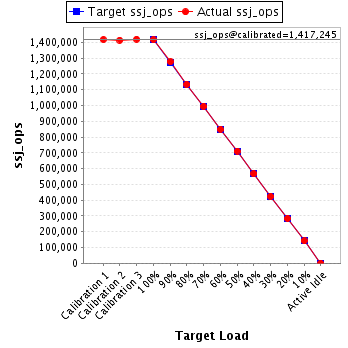
| ssj_ops@calibrated=1,417,245 | |||
| 100% | 100.0% | 1,417,245 | 1,416,689 |
| 90% | 90.1% | 1,275,521 | 1,277,511 |
| 80% | 80.0% | 1,133,796 | 1,133,814 |
| 70% | 70.3% | 992,072 | 995,738 |
| 60% | 60.0% | 850,347 | 850,179 |
| 50% | 50.2% | 708,623 | 711,220 |
| 40% | 40.0% | 566,898 | 566,798 |
| 30% | 29.9% | 425,174 | 423,688 |
| 20% | 20.0% | 283,449 | 283,353 |
| 10% | 10.0% | 141,725 | 141,534 |
| Active Idle | 0 | 0 | |
| Target Load | Actual Load | ssj_ops | |
|---|---|---|---|
| Target | Actual | ||
| Calibration 1 | 1,416,096 | ||
| Calibration 2 | 1,413,835 | ||
| Calibration 3 | 1,415,061 | ||
| ssj_ops@calibrated=1,414,448 | |||
| 100% | 99.8% | 1,414,448 | 1,411,508 |
| 90% | 89.9% | 1,273,003 | 1,271,844 |
| 80% | 80.2% | 1,131,558 | 1,133,694 |
| 70% | 70.1% | 990,113 | 992,192 |
| 60% | 60.0% | 848,669 | 848,516 |
| 50% | 50.1% | 707,224 | 709,266 |
| 40% | 40.3% | 565,779 | 569,836 |
| 30% | 29.9% | 424,334 | 423,474 |
| 20% | 20.0% | 282,890 | 282,241 |
| 10% | 10.0% | 141,445 | 141,879 |
| Active Idle | 0 | 0 | |
