| Target Load |
Actual Load |
ssj_ops |
| Target |
Actual |
| Calibration 1 |
|
|
1,500,153 |
| Calibration 2 |
|
|
1,497,939 |
| Calibration 3 |
|
|
1,496,183 |
| ssj_ops@calibrated=1,497,061 |
| 100% |
100.1% |
1,497,061 |
1,498,077 |
| 90% |
90.1% |
1,347,355 |
1,349,091 |
| 80% |
79.9% |
1,197,649 |
1,196,770 |
| 70% |
69.7% |
1,047,943 |
1,043,440 |
| 60% |
60.1% |
898,237 |
899,969 |
| 50% |
50.0% |
748,531 |
748,862 |
| 40% |
39.9% |
598,824 |
597,459 |
| 30% |
30.1% |
449,118 |
450,184 |
| 20% |
20.0% |
299,412 |
298,951 |
| 10% |
10.1% |
149,706 |
150,853 |
| Active Idle |
|
0 |
0 |
| JVM Instance |
ssj_ops@100% |
| GinMall.001 |
76,007 |
| GinMall.002 |
76,331 |
| GinMall.003 |
75,337 |
| GinMall.004 |
76,814 |
| GinMall.005 |
74,562 |
| GinMall.006 |
74,468 |
| GinMall.007 |
73,201 |
| GinMall.008 |
74,489 |
| GinMall.009 |
73,805 |
| GinMall.010 |
74,737 |
| GinMall.011 |
75,022 |
| GinMall.012 |
74,422 |
| GinMall.013 |
74,471 |
| GinMall.014 |
74,763 |
| GinMall.015 |
74,162 |
| GinMall.016 |
72,722 |
| GinMall.017 |
76,990 |
| GinMall.018 |
77,713 |
| GinMall.019 |
73,278 |
| GinMall.020 |
74,783 |
| ssj_ops@100% |
1,498,077 |
| ssj_ops@100% per JVM |
74,904 |
JVM 'GinMall.001' Scores:
| Target Load |
Actual Load |
ssj_ops |
| Target |
Actual |
| Calibration 1 |
|
|
73,910 |
| Calibration 2 |
|
|
74,764 |
| Calibration 3 |
|
|
76,752 |
| ssj_ops@calibrated=75,758 |
| 100% |
100.3% |
75,758 |
76,007 |
| 90% |
90.6% |
68,182 |
68,635 |
| 80% |
80.0% |
60,606 |
60,600 |
| 70% |
69.6% |
53,030 |
52,701 |
| 60% |
59.9% |
45,455 |
45,360 |
| 50% |
50.7% |
37,879 |
38,424 |
| 40% |
39.7% |
30,303 |
30,076 |
| 30% |
30.6% |
22,727 |
23,160 |
| 20% |
20.2% |
15,152 |
15,299 |
| 10% |
10.3% |
7,576 |
7,800 |
| Active Idle |
|
0 |
0 |
JVM 'GinMall.002' Scores:
| Target Load |
Actual Load |
ssj_ops |
| Target |
Actual |
| Calibration 1 |
|
|
76,812 |
| Calibration 2 |
|
|
75,674 |
| Calibration 3 |
|
|
74,464 |
| ssj_ops@calibrated=75,069 |
| 100% |
101.7% |
75,069 |
76,331 |
| 90% |
91.0% |
67,562 |
68,349 |
| 80% |
79.9% |
60,055 |
59,986 |
| 70% |
69.8% |
52,548 |
52,416 |
| 60% |
60.0% |
45,041 |
45,068 |
| 50% |
50.3% |
37,535 |
37,754 |
| 40% |
39.6% |
30,028 |
29,723 |
| 30% |
30.1% |
22,521 |
22,611 |
| 20% |
20.5% |
15,014 |
15,377 |
| 10% |
10.0% |
7,507 |
7,536 |
| Active Idle |
|
0 |
0 |
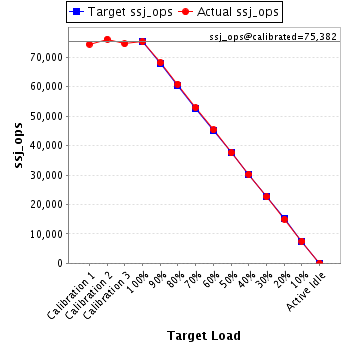
JVM 'GinMall.003' Scores:
| Target Load |
Actual Load |
ssj_ops |
| Target |
Actual |
| Calibration 1 |
|
|
74,495 |
| Calibration 2 |
|
|
76,189 |
| Calibration 3 |
|
|
74,576 |
| ssj_ops@calibrated=75,382 |
| 100% |
99.9% |
75,382 |
75,337 |
| 90% |
90.5% |
67,844 |
68,192 |
| 80% |
80.8% |
60,306 |
60,894 |
| 70% |
70.2% |
52,768 |
52,913 |
| 60% |
60.1% |
45,229 |
45,332 |
| 50% |
49.9% |
37,691 |
37,604 |
| 40% |
40.1% |
30,153 |
30,253 |
| 30% |
30.0% |
22,615 |
22,585 |
| 20% |
19.8% |
15,076 |
14,954 |
| 10% |
9.9% |
7,538 |
7,492 |
| Active Idle |
|
0 |
0 |
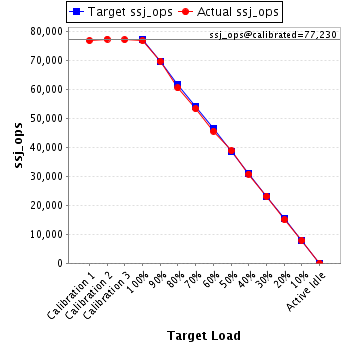
JVM 'GinMall.004' Scores:
| Target Load |
Actual Load |
ssj_ops |
| Target |
Actual |
| Calibration 1 |
|
|
76,846 |
| Calibration 2 |
|
|
77,327 |
| Calibration 3 |
|
|
77,133 |
| ssj_ops@calibrated=77,230 |
| 100% |
99.5% |
77,230 |
76,814 |
| 90% |
90.3% |
69,507 |
69,732 |
| 80% |
78.4% |
61,784 |
60,531 |
| 70% |
69.0% |
54,061 |
53,325 |
| 60% |
59.0% |
46,338 |
45,604 |
| 50% |
50.3% |
38,615 |
38,843 |
| 40% |
39.9% |
30,892 |
30,795 |
| 30% |
29.9% |
23,169 |
23,114 |
| 20% |
19.4% |
15,446 |
15,008 |
| 10% |
10.2% |
7,723 |
7,875 |
| Active Idle |
|
0 |
0 |
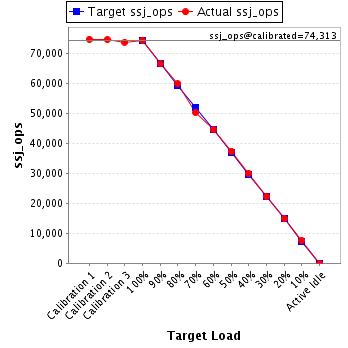
JVM 'GinMall.005' Scores:
| Target Load |
Actual Load |
ssj_ops |
| Target |
Actual |
| Calibration 1 |
|
|
74,895 |
| Calibration 2 |
|
|
74,736 |
| Calibration 3 |
|
|
73,890 |
| ssj_ops@calibrated=74,313 |
| 100% |
100.3% |
74,313 |
74,562 |
| 90% |
89.7% |
66,882 |
66,680 |
| 80% |
80.7% |
59,450 |
59,971 |
| 70% |
67.7% |
52,019 |
50,343 |
| 60% |
60.0% |
44,588 |
44,552 |
| 50% |
50.3% |
37,156 |
37,408 |
| 40% |
40.4% |
29,725 |
29,991 |
| 30% |
30.1% |
22,294 |
22,367 |
| 20% |
20.1% |
14,863 |
14,921 |
| 10% |
10.3% |
7,431 |
7,650 |
| Active Idle |
|
0 |
0 |
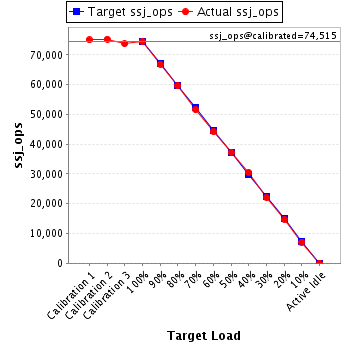
JVM 'GinMall.006' Scores:
| Target Load |
Actual Load |
ssj_ops |
| Target |
Actual |
| Calibration 1 |
|
|
74,991 |
| Calibration 2 |
|
|
75,260 |
| Calibration 3 |
|
|
73,770 |
| ssj_ops@calibrated=74,515 |
| 100% |
99.9% |
74,515 |
74,468 |
| 90% |
89.7% |
67,064 |
66,868 |
| 80% |
79.9% |
59,612 |
59,550 |
| 70% |
69.3% |
52,161 |
51,617 |
| 60% |
59.4% |
44,709 |
44,239 |
| 50% |
50.0% |
37,258 |
37,224 |
| 40% |
40.9% |
29,806 |
30,493 |
| 30% |
29.6% |
22,355 |
22,067 |
| 20% |
19.9% |
14,903 |
14,804 |
| 10% |
9.6% |
7,452 |
7,121 |
| Active Idle |
|
0 |
0 |
JVM 'GinMall.007' Scores:
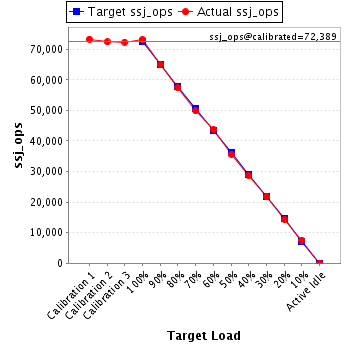
| Target Load |
Actual Load |
ssj_ops |
| Target |
Actual |
| Calibration 1 |
|
|
73,296 |
| Calibration 2 |
|
|
72,420 |
| Calibration 3 |
|
|
72,358 |
| ssj_ops@calibrated=72,389 |
| 100% |
101.1% |
72,389 |
73,201 |
| 90% |
89.8% |
65,150 |
65,014 |
| 80% |
79.4% |
57,911 |
57,463 |
| 70% |
68.9% |
50,672 |
49,899 |
| 60% |
60.4% |
43,434 |
43,749 |
| 50% |
49.2% |
36,195 |
35,618 |
| 40% |
39.8% |
28,956 |
28,834 |
| 30% |
30.1% |
21,717 |
21,799 |
| 20% |
19.8% |
14,478 |
14,298 |
| 10% |
10.4% |
7,239 |
7,554 |
| Active Idle |
|
0 |
0 |
JVM 'GinMall.008' Scores:
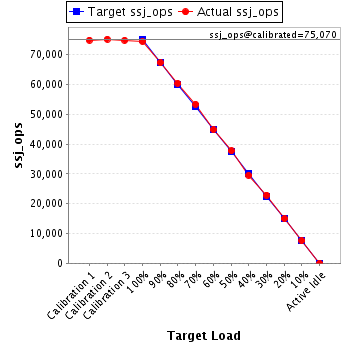
| Target Load |
Actual Load |
ssj_ops |
| Target |
Actual |
| Calibration 1 |
|
|
74,952 |
| Calibration 2 |
|
|
75,235 |
| Calibration 3 |
|
|
74,905 |
| ssj_ops@calibrated=75,070 |
| 100% |
99.2% |
75,070 |
74,489 |
| 90% |
89.8% |
67,563 |
67,384 |
| 80% |
80.5% |
60,056 |
60,435 |
| 70% |
71.2% |
52,549 |
53,420 |
| 60% |
59.7% |
45,042 |
44,853 |
| 50% |
50.3% |
37,535 |
37,758 |
| 40% |
39.4% |
30,028 |
29,546 |
| 30% |
30.5% |
22,521 |
22,908 |
| 20% |
20.0% |
15,014 |
14,996 |
| 10% |
10.1% |
7,507 |
7,612 |
| Active Idle |
|
0 |
0 |
JVM 'GinMall.009' Scores:
| Target Load |
Actual Load |
ssj_ops |
| Target |
Actual |
| Calibration 1 |
|
|
74,634 |
| Calibration 2 |
|
|
74,085 |
| Calibration 3 |
|
|
74,168 |
| ssj_ops@calibrated=74,127 |
| 100% |
99.6% |
74,127 |
73,805 |
| 90% |
90.8% |
66,714 |
67,335 |
| 80% |
79.8% |
59,301 |
59,185 |
| 70% |
69.0% |
51,889 |
51,162 |
| 60% |
61.8% |
44,476 |
45,807 |
| 50% |
50.0% |
37,063 |
37,082 |
| 40% |
39.9% |
29,651 |
29,586 |
| 30% |
29.7% |
22,238 |
22,000 |
| 20% |
19.9% |
14,825 |
14,743 |
| 10% |
10.1% |
7,413 |
7,456 |
| Active Idle |
|
0 |
0 |
JVM 'GinMall.010' Scores:
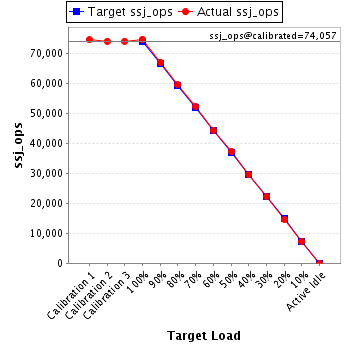
| Target Load |
Actual Load |
ssj_ops |
| Target |
Actual |
| Calibration 1 |
|
|
74,499 |
| Calibration 2 |
|
|
74,020 |
| Calibration 3 |
|
|
74,093 |
| ssj_ops@calibrated=74,057 |
| 100% |
100.9% |
74,057 |
74,737 |
| 90% |
90.6% |
66,651 |
67,095 |
| 80% |
80.4% |
59,245 |
59,521 |
| 70% |
70.7% |
51,840 |
52,388 |
| 60% |
59.8% |
44,434 |
44,303 |
| 50% |
50.2% |
37,028 |
37,196 |
| 40% |
39.8% |
29,623 |
29,458 |
| 30% |
30.1% |
22,217 |
22,292 |
| 20% |
19.8% |
14,811 |
14,650 |
| 10% |
9.8% |
7,406 |
7,287 |
| Active Idle |
|
0 |
0 |
JVM 'GinMall.011' Scores:
| Target Load |
Actual Load |
ssj_ops |
| Target |
Actual |
| Calibration 1 |
|
|
76,033 |
| Calibration 2 |
|
|
75,369 |
| Calibration 3 |
|
|
75,772 |
| ssj_ops@calibrated=75,571 |
| 100% |
99.3% |
75,571 |
75,022 |
| 90% |
91.1% |
68,014 |
68,875 |
| 80% |
80.5% |
60,457 |
60,866 |
| 70% |
69.6% |
52,899 |
52,634 |
| 60% |
59.2% |
45,342 |
44,746 |
| 50% |
49.9% |
37,785 |
37,709 |
| 40% |
40.5% |
30,228 |
30,608 |
| 30% |
30.4% |
22,671 |
22,971 |
| 20% |
19.6% |
15,114 |
14,788 |
| 10% |
10.4% |
7,557 |
7,846 |
| Active Idle |
|
0 |
0 |
JVM 'GinMall.012' Scores:
| Target Load |
Actual Load |
ssj_ops |
| Target |
Actual |
| Calibration 1 |
|
|
75,917 |
| Calibration 2 |
|
|
74,946 |
| Calibration 3 |
|
|
73,941 |
| ssj_ops@calibrated=74,443 |
| 100% |
100.0% |
74,443 |
74,422 |
| 90% |
89.7% |
66,999 |
66,767 |
| 80% |
79.1% |
59,555 |
58,917 |
| 70% |
69.7% |
52,110 |
51,851 |
| 60% |
61.4% |
44,666 |
45,690 |
| 50% |
49.9% |
37,222 |
37,136 |
| 40% |
39.0% |
29,777 |
29,016 |
| 30% |
30.2% |
22,333 |
22,507 |
| 20% |
20.0% |
14,889 |
14,862 |
| 10% |
10.1% |
7,444 |
7,513 |
| Active Idle |
|
0 |
0 |
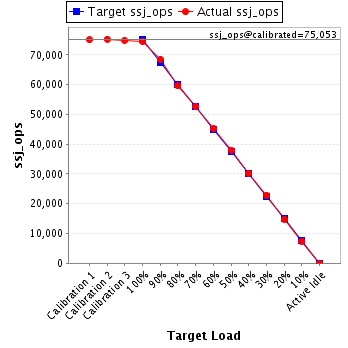
JVM 'GinMall.013' Scores:
| Target Load |
Actual Load |
ssj_ops |
| Target |
Actual |
| Calibration 1 |
|
|
75,025 |
| Calibration 2 |
|
|
75,260 |
| Calibration 3 |
|
|
74,845 |
| ssj_ops@calibrated=75,053 |
| 100% |
99.2% |
75,053 |
74,471 |
| 90% |
91.3% |
67,547 |
68,496 |
| 80% |
79.4% |
60,042 |
59,583 |
| 70% |
70.0% |
52,537 |
52,563 |
| 60% |
60.2% |
45,032 |
45,201 |
| 50% |
50.6% |
37,526 |
37,979 |
| 40% |
40.2% |
30,021 |
30,182 |
| 30% |
30.5% |
22,516 |
22,871 |
| 20% |
19.7% |
15,011 |
14,783 |
| 10% |
10.0% |
7,505 |
7,471 |
| Active Idle |
|
0 |
0 |
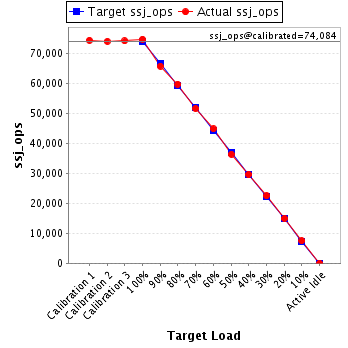
JVM 'GinMall.014' Scores:
| Target Load |
Actual Load |
ssj_ops |
| Target |
Actual |
| Calibration 1 |
|
|
74,391 |
| Calibration 2 |
|
|
74,007 |
| Calibration 3 |
|
|
74,161 |
| ssj_ops@calibrated=74,084 |
| 100% |
100.9% |
74,084 |
74,763 |
| 90% |
88.8% |
66,675 |
65,788 |
| 80% |
80.7% |
59,267 |
59,772 |
| 70% |
69.7% |
51,858 |
51,634 |
| 60% |
60.5% |
44,450 |
44,818 |
| 50% |
49.1% |
37,042 |
36,354 |
| 40% |
40.0% |
29,633 |
29,608 |
| 30% |
30.4% |
22,225 |
22,488 |
| 20% |
20.2% |
14,817 |
14,967 |
| 10% |
10.2% |
7,408 |
7,529 |
| Active Idle |
|
0 |
0 |
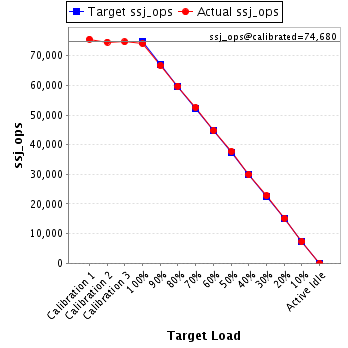
JVM 'GinMall.015' Scores:
| Target Load |
Actual Load |
ssj_ops |
| Target |
Actual |
| Calibration 1 |
|
|
75,617 |
| Calibration 2 |
|
|
74,656 |
| Calibration 3 |
|
|
74,703 |
| ssj_ops@calibrated=74,680 |
| 100% |
99.3% |
74,680 |
74,162 |
| 90% |
89.3% |
67,212 |
66,699 |
| 80% |
80.0% |
59,744 |
59,755 |
| 70% |
70.5% |
52,276 |
52,614 |
| 60% |
60.0% |
44,808 |
44,801 |
| 50% |
50.6% |
37,340 |
37,770 |
| 40% |
40.1% |
29,872 |
29,967 |
| 30% |
30.5% |
22,404 |
22,767 |
| 20% |
20.4% |
14,936 |
15,200 |
| 10% |
9.8% |
7,468 |
7,340 |
| Active Idle |
|
0 |
0 |
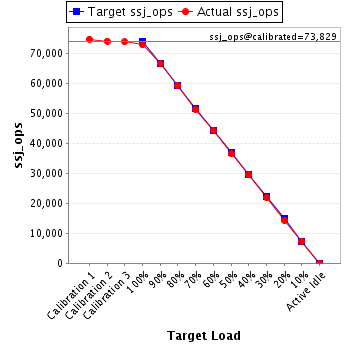
JVM 'GinMall.016' Scores:
| Target Load |
Actual Load |
ssj_ops |
| Target |
Actual |
| Calibration 1 |
|
|
74,611 |
| Calibration 2 |
|
|
73,955 |
| Calibration 3 |
|
|
73,703 |
| ssj_ops@calibrated=73,829 |
| 100% |
98.5% |
73,829 |
72,722 |
| 90% |
90.0% |
66,446 |
66,421 |
| 80% |
80.0% |
59,063 |
59,091 |
| 70% |
69.3% |
51,680 |
51,158 |
| 60% |
60.0% |
44,298 |
44,297 |
| 50% |
49.3% |
36,915 |
36,399 |
| 40% |
39.9% |
29,532 |
29,442 |
| 30% |
29.6% |
22,149 |
21,822 |
| 20% |
19.4% |
14,766 |
14,337 |
| 10% |
9.9% |
7,383 |
7,287 |
| Active Idle |
|
0 |
0 |
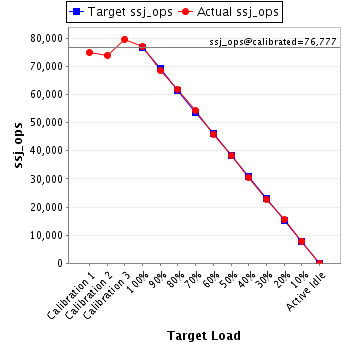
JVM 'GinMall.017' Scores:
| Target Load |
Actual Load |
ssj_ops |
| Target |
Actual |
| Calibration 1 |
|
|
74,825 |
| Calibration 2 |
|
|
73,889 |
| Calibration 3 |
|
|
79,666 |
| ssj_ops@calibrated=76,777 |
| 100% |
100.3% |
76,777 |
76,990 |
| 90% |
89.3% |
69,100 |
68,589 |
| 80% |
80.6% |
61,422 |
61,885 |
| 70% |
70.6% |
53,744 |
54,215 |
| 60% |
59.8% |
46,066 |
45,946 |
| 50% |
49.8% |
38,389 |
38,233 |
| 40% |
39.9% |
30,711 |
30,608 |
| 30% |
29.7% |
23,033 |
22,828 |
| 20% |
20.2% |
15,355 |
15,479 |
| 10% |
10.3% |
7,678 |
7,887 |
| Active Idle |
|
0 |
0 |
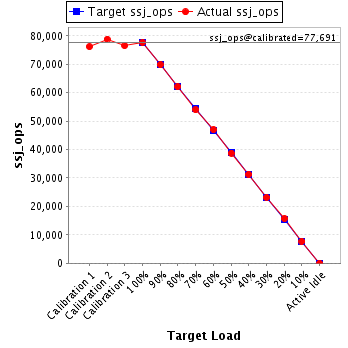
JVM 'GinMall.018' Scores:
| Target Load |
Actual Load |
ssj_ops |
| Target |
Actual |
| Calibration 1 |
|
|
76,156 |
| Calibration 2 |
|
|
78,841 |
| Calibration 3 |
|
|
76,540 |
| ssj_ops@calibrated=77,691 |
| 100% |
100.0% |
77,691 |
77,713 |
| 90% |
89.9% |
69,921 |
69,843 |
| 80% |
80.0% |
62,152 |
62,122 |
| 70% |
69.4% |
54,383 |
53,946 |
| 60% |
60.5% |
46,614 |
47,017 |
| 50% |
49.9% |
38,845 |
38,733 |
| 40% |
40.3% |
31,076 |
31,304 |
| 30% |
29.8% |
23,307 |
23,115 |
| 20% |
20.3% |
15,538 |
15,754 |
| 10% |
9.9% |
7,769 |
7,708 |
| Active Idle |
|
0 |
0 |
JVM 'GinMall.019' Scores:
| Target Load |
Actual Load |
ssj_ops |
| Target |
Actual |
| Calibration 1 |
|
|
73,940 |
| Calibration 2 |
|
|
73,326 |
| Calibration 3 |
|
|
73,053 |
| ssj_ops@calibrated=73,189 |
| 100% |
100.1% |
73,189 |
73,278 |
| 90% |
89.5% |
65,871 |
65,536 |
| 80% |
79.3% |
58,552 |
58,031 |
| 70% |
69.7% |
51,233 |
50,988 |
| 60% |
61.3% |
43,914 |
44,873 |
| 50% |
50.4% |
36,595 |
36,859 |
| 40% |
39.5% |
29,276 |
28,946 |
| 30% |
29.9% |
21,957 |
21,858 |
| 20% |
20.6% |
14,638 |
15,079 |
| 10% |
9.9% |
7,319 |
7,233 |
| Active Idle |
|
0 |
0 |
JVM 'GinMall.020' Scores:
| Target Load |
Actual Load |
ssj_ops |
| Target |
Actual |
| Calibration 1 |
|
|
74,308 |
| Calibration 2 |
|
|
73,978 |
| Calibration 3 |
|
|
73,692 |
| ssj_ops@calibrated=73,835 |
| 100% |
101.3% |
73,835 |
74,783 |
| 90% |
90.5% |
66,451 |
66,793 |
| 80% |
79.4% |
59,068 |
58,613 |
| 70% |
70.0% |
51,684 |
51,653 |
| 60% |
59.2% |
44,301 |
43,715 |
| 50% |
49.8% |
36,917 |
36,777 |
| 40% |
39.3% |
29,534 |
29,024 |
| 30% |
29.9% |
22,150 |
22,054 |
| 20% |
19.8% |
14,767 |
14,650 |
| 10% |
10.4% |
7,383 |
7,654 |
| Active Idle |
|
0 |
0 |