| Target Load |
Actual Load |
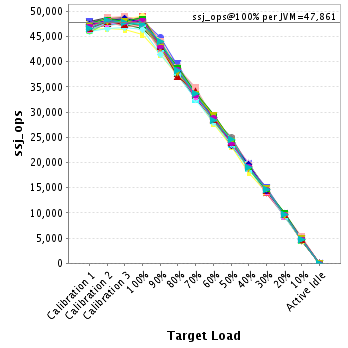
ssj_ops |
| Target |
Actual |
| Calibration 1 |
|
|
2,258,203 |
| Calibration 2 |
|
|
2,303,093 |
| Calibration 3 |
|
|
2,304,058 |
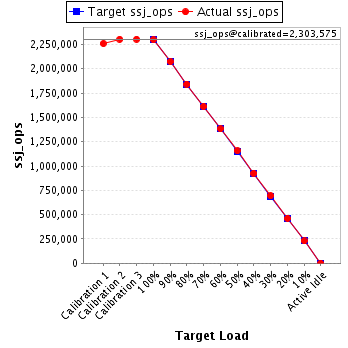
| ssj_ops@calibrated=2,303,575 |
| 100% |
99.7% |
2,303,575 |
2,297,344 |
| 90% |
90.0% |
2,073,218 |
2,073,591 |
| 80% |
79.9% |
1,842,860 |
1,841,179 |
| 70% |
70.0% |
1,612,503 |
1,612,999 |
| 60% |
60.0% |
1,382,145 |
1,380,996 |
| 50% |
50.1% |
1,151,788 |
1,154,911 |
| 40% |
40.1% |
921,430 |
924,044 |
| 30% |
30.1% |
691,073 |
692,791 |
| 20% |
20.1% |
460,715 |
462,327 |
| 10% |
9.9% |
230,358 |
229,125 |
| Active Idle |
|
0 |
0 |
| JVM Instance |
ssj_ops@100% |
| localhost.001 |
49,024 |
| localhost.002 |
48,277 |
| localhost.003 |
47,927 |
| localhost.004 |
48,303 |
| localhost.005 |
48,090 |
| localhost.006 |
48,294 |
| localhost.007 |
47,453 |
| localhost.008 |
47,785 |
| localhost.009 |
47,633 |
| localhost.010 |
47,753 |
| localhost.011 |
48,372 |
| localhost.012 |
48,376 |
| localhost.013 |
48,525 |
| localhost.014 |
48,516 |
| localhost.015 |
48,153 |
| localhost.016 |
47,746 |
| localhost.017 |
47,416 |
| localhost.018 |
48,103 |
| localhost.019 |
45,334 |
| localhost.020 |
48,274 |
| localhost.021 |
47,755 |
| localhost.022 |
47,778 |
| localhost.023 |
47,044 |
| localhost.024 |
47,271 |
| localhost.025 |
46,688 |
| localhost.026 |
47,687 |
| localhost.027 |
48,352 |
| localhost.028 |
47,849 |
| localhost.029 |
47,212 |
| localhost.030 |
48,004 |
| localhost.031 |
47,634 |
| localhost.032 |
48,937 |
| localhost.033 |
47,843 |
| localhost.034 |
46,461 |
| localhost.035 |
48,619 |
| localhost.036 |
47,750 |
| localhost.037 |
47,422 |
| localhost.038 |
47,627 |
| localhost.039 |
47,614 |
| localhost.040 |
47,580 |
| localhost.041 |
48,226 |
| localhost.042 |
48,359 |
| localhost.043 |
48,111 |
| localhost.044 |
47,815 |
| localhost.045 |
48,741 |
| localhost.046 |
47,730 |
| localhost.047 |
48,379 |
| localhost.048 |
47,501 |
| ssj_ops@100% |
2,297,344 |
| ssj_ops@100% per JVM |
47,861 |
JVM 'localhost.001' Scores:
| Target Load |
Actual Load |
ssj_ops |
| Target |
Actual |
| Calibration 1 |
|
|
47,305 |
| Calibration 2 |
|
|
48,272 |
| Calibration 3 |
|
|
48,151 |
| ssj_ops@calibrated=48,211 |
| 100% |
101.7% |
48,211 |
49,024 |
| 90% |
89.5% |
43,390 |
43,138 |
| 80% |
79.9% |
38,569 |
38,512 |
| 70% |
70.4% |
33,748 |
33,927 |
| 60% |
59.9% |
28,927 |
28,901 |
| 50% |
50.9% |
24,106 |
24,517 |
| 40% |
40.4% |
19,285 |
19,491 |
| 30% |
30.2% |
14,463 |
14,546 |
| 20% |
20.0% |
9,642 |
9,620 |
| 10% |
10.0% |
4,821 |
4,833 |
| Active Idle |
|
0 |
0 |
JVM 'localhost.002' Scores:
| Target Load |
Actual Load |
ssj_ops |
| Target |
Actual |
| Calibration 1 |
|
|
47,146 |
| Calibration 2 |
|
|
48,189 |
| Calibration 3 |
|
|
48,063 |
| ssj_ops@calibrated=48,126 |
| 100% |
100.3% |
48,126 |
48,277 |
| 90% |
93.1% |
43,314 |
44,817 |
| 80% |
81.4% |
38,501 |
39,177 |
| 70% |
70.4% |
33,688 |
33,875 |
| 60% |
59.9% |
28,876 |
28,815 |
| 50% |
50.3% |
24,063 |
24,223 |
| 40% |
40.4% |
19,250 |
19,424 |
| 30% |
29.9% |
14,438 |
14,412 |
| 20% |
20.1% |
9,625 |
9,654 |
| 10% |
10.1% |
4,813 |
4,837 |
| Active Idle |
|
0 |
0 |
JVM 'localhost.003' Scores:
| Target Load |
Actual Load |
ssj_ops |
| Target |
Actual |
| Calibration 1 |
|
|
47,414 |
| Calibration 2 |
|
|
48,068 |
| Calibration 3 |
|
|
47,934 |
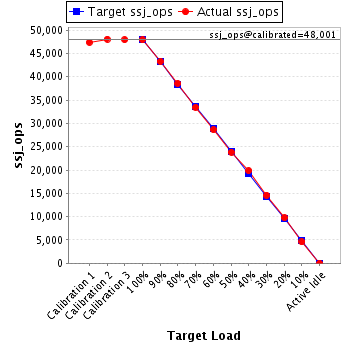
| ssj_ops@calibrated=48,001 |
| 100% |
99.8% |
48,001 |
47,927 |
| 90% |
90.2% |
43,201 |
43,306 |
| 80% |
80.4% |
38,401 |
38,596 |
| 70% |
69.7% |
33,601 |
33,458 |
| 60% |
59.7% |
28,801 |
28,641 |
| 50% |
49.6% |
24,000 |
23,831 |
| 40% |
41.4% |
19,200 |
19,849 |
| 30% |
30.4% |
14,400 |
14,608 |
| 20% |
20.3% |
9,600 |
9,767 |
| 10% |
9.5% |
4,800 |
4,579 |
| Active Idle |
|
0 |
0 |
JVM 'localhost.004' Scores:
| Target Load |
Actual Load |
ssj_ops |
| Target |
Actual |
| Calibration 1 |
|
|
47,299 |
| Calibration 2 |
|
|
48,265 |
| Calibration 3 |
|
|
48,192 |
| ssj_ops@calibrated=48,228 |
| 100% |
100.2% |
48,228 |
48,303 |
| 90% |
89.7% |
43,406 |
43,255 |
| 80% |
79.5% |
38,583 |
38,357 |
| 70% |
71.1% |
33,760 |
34,283 |
| 60% |
59.9% |
28,937 |
28,908 |
| 50% |
50.4% |
24,114 |
24,291 |
| 40% |
39.9% |
19,291 |
19,220 |
| 30% |
30.9% |
14,469 |
14,904 |
| 20% |
19.5% |
9,646 |
9,395 |
| 10% |
9.8% |
4,823 |
4,724 |
| Active Idle |
|
0 |
0 |
JVM 'localhost.005' Scores:
| Target Load |
Actual Load |
ssj_ops |
| Target |
Actual |
| Calibration 1 |
|
|
47,250 |
| Calibration 2 |
|
|
48,373 |
| Calibration 3 |
|
|
48,528 |
| ssj_ops@calibrated=48,450 |
| 100% |
99.3% |
48,450 |
48,090 |
| 90% |
89.7% |
43,605 |
43,452 |
| 80% |
80.3% |
38,760 |
38,924 |
| 70% |
69.8% |
33,915 |
33,805 |
| 60% |
59.7% |
29,070 |
28,923 |
| 50% |
50.3% |
24,225 |
24,383 |
| 40% |
39.7% |
19,380 |
19,233 |
| 30% |
30.2% |
14,535 |
14,625 |
| 20% |
20.0% |
9,690 |
9,699 |
| 10% |
9.6% |
4,845 |
4,642 |
| Active Idle |
|
0 |
0 |
JVM 'localhost.006' Scores:
| Target Load |
Actual Load |
ssj_ops |
| Target |
Actual |
| Calibration 1 |
|
|
47,587 |
| Calibration 2 |
|
|
48,773 |
| Calibration 3 |
|
|
48,599 |
| ssj_ops@calibrated=48,686 |
| 100% |
99.2% |
48,686 |
48,294 |
| 90% |
90.1% |
43,817 |
43,867 |
| 80% |
80.0% |
38,949 |
38,927 |
| 70% |
69.3% |
34,080 |
33,759 |
| 60% |
59.3% |
29,211 |
28,887 |
| 50% |
50.0% |
24,343 |
24,325 |
| 40% |
40.4% |
19,474 |
19,656 |
| 30% |
29.5% |
14,606 |
14,374 |
| 20% |
19.9% |
9,737 |
9,703 |
| 10% |
10.0% |
4,869 |
4,854 |
| Active Idle |
|
0 |
0 |
JVM 'localhost.007' Scores:
| Target Load |
Actual Load |
ssj_ops |
| Target |
Actual |
| Calibration 1 |
|
|
46,804 |
| Calibration 2 |
|
|
47,272 |
| Calibration 3 |
|
|
47,559 |
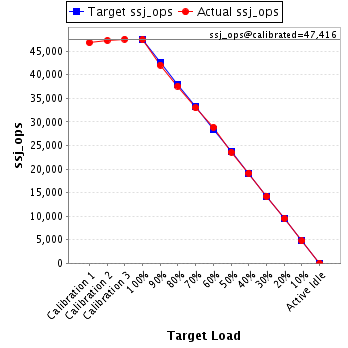
| ssj_ops@calibrated=47,416 |
| 100% |
100.1% |
47,416 |
47,453 |
| 90% |
88.7% |
42,674 |
42,074 |
| 80% |
79.3% |
37,933 |
37,604 |
| 70% |
69.5% |
33,191 |
32,976 |
| 60% |
60.8% |
28,450 |
28,850 |
| 50% |
49.7% |
23,708 |
23,572 |
| 40% |
40.4% |
18,966 |
19,137 |
| 30% |
30.0% |
14,225 |
14,215 |
| 20% |
20.0% |
9,483 |
9,487 |
| 10% |
10.0% |
4,742 |
4,750 |
| Active Idle |
|
0 |
0 |
JVM 'localhost.008' Scores:
| Target Load |
Actual Load |
ssj_ops |
| Target |
Actual |
| Calibration 1 |
|
|
47,104 |
| Calibration 2 |
|
|
47,656 |
| Calibration 3 |
|
|
47,900 |
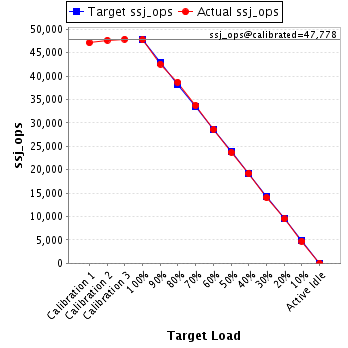
| ssj_ops@calibrated=47,778 |
| 100% |
100.0% |
47,778 |
47,785 |
| 90% |
89.1% |
43,001 |
42,572 |
| 80% |
81.0% |
38,223 |
38,694 |
| 70% |
70.6% |
33,445 |
33,755 |
| 60% |
59.8% |
28,667 |
28,594 |
| 50% |
49.6% |
23,889 |
23,691 |
| 40% |
40.2% |
19,111 |
19,208 |
| 30% |
29.4% |
14,334 |
14,032 |
| 20% |
19.8% |
9,556 |
9,462 |
| 10% |
9.8% |
4,778 |
4,704 |
| Active Idle |
|
0 |
0 |
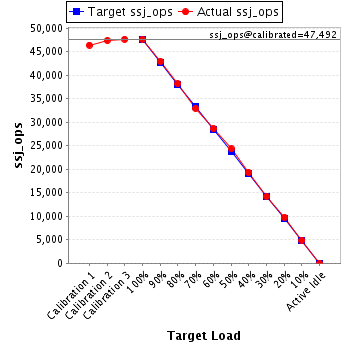
JVM 'localhost.009' Scores:
| Target Load |
Actual Load |
ssj_ops |
| Target |
Actual |
| Calibration 1 |
|
|
46,382 |
| Calibration 2 |
|
|
47,354 |
| Calibration 3 |
|
|
47,630 |
| ssj_ops@calibrated=47,492 |
| 100% |
100.3% |
47,492 |
47,633 |
| 90% |
90.4% |
42,743 |
42,931 |
| 80% |
80.4% |
37,994 |
38,177 |
| 70% |
69.3% |
33,245 |
32,922 |
| 60% |
60.3% |
28,495 |
28,654 |
| 50% |
51.2% |
23,746 |
24,339 |
| 40% |
40.6% |
18,997 |
19,271 |
| 30% |
29.9% |
14,248 |
14,206 |
| 20% |
20.6% |
9,498 |
9,762 |
| 10% |
10.3% |
4,749 |
4,879 |
| Active Idle |
|
0 |
0 |
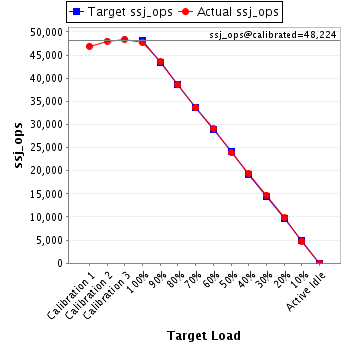
JVM 'localhost.010' Scores:
| Target Load |
Actual Load |
ssj_ops |
| Target |
Actual |
| Calibration 1 |
|
|
46,931 |
| Calibration 2 |
|
|
48,012 |
| Calibration 3 |
|
|
48,436 |
| ssj_ops@calibrated=48,224 |
| 100% |
99.0% |
48,224 |
47,753 |
| 90% |
90.3% |
43,402 |
43,535 |
| 80% |
80.1% |
38,580 |
38,618 |
| 70% |
69.7% |
33,757 |
33,635 |
| 60% |
60.2% |
28,935 |
29,054 |
| 50% |
49.6% |
24,112 |
23,905 |
| 40% |
40.2% |
19,290 |
19,366 |
| 30% |
30.5% |
14,467 |
14,687 |
| 20% |
20.3% |
9,645 |
9,800 |
| 10% |
10.0% |
4,822 |
4,804 |
| Active Idle |
|
0 |
0 |
JVM 'localhost.011' Scores:
| Target Load |
Actual Load |
ssj_ops |
| Target |
Actual |
| Calibration 1 |
|
|
47,020 |
| Calibration 2 |
|
|
48,237 |
| Calibration 3 |
|
|
48,450 |
| ssj_ops@calibrated=48,344 |
| 100% |
100.1% |
48,344 |
48,372 |
| 90% |
90.7% |
43,509 |
43,868 |
| 80% |
78.4% |
38,675 |
37,898 |
| 70% |
69.4% |
33,840 |
33,561 |
| 60% |
59.3% |
29,006 |
28,662 |
| 50% |
49.4% |
24,172 |
23,866 |
| 40% |
39.5% |
19,337 |
19,085 |
| 30% |
30.1% |
14,503 |
14,530 |
| 20% |
20.2% |
9,669 |
9,758 |
| 10% |
9.7% |
4,834 |
4,696 |
| Active Idle |
|
0 |
0 |
JVM 'localhost.012' Scores:
| Target Load |
Actual Load |
ssj_ops |
| Target |
Actual |
| Calibration 1 |
|
|
46,949 |
| Calibration 2 |
|
|
47,784 |
| Calibration 3 |
|
|
48,236 |
| ssj_ops@calibrated=48,010 |
| 100% |
100.8% |
48,010 |
48,376 |
| 90% |
89.6% |
43,209 |
43,040 |
| 80% |
79.4% |
38,408 |
38,128 |
| 70% |
69.7% |
33,607 |
33,480 |
| 60% |
59.8% |
28,806 |
28,712 |
| 50% |
50.8% |
24,005 |
24,407 |
| 40% |
40.6% |
19,204 |
19,490 |
| 30% |
29.7% |
14,403 |
14,268 |
| 20% |
19.9% |
9,602 |
9,571 |
| 10% |
10.0% |
4,801 |
4,815 |
| Active Idle |
|
0 |
0 |
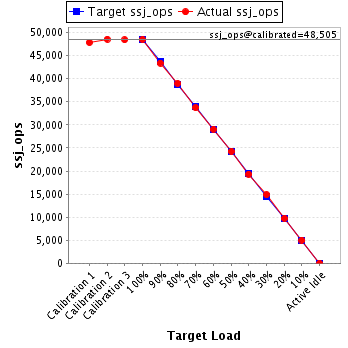
JVM 'localhost.013' Scores:
| Target Load |
Actual Load |
ssj_ops |
| Target |
Actual |
| Calibration 1 |
|
|
47,871 |
| Calibration 2 |
|
|
48,581 |
| Calibration 3 |
|
|
48,430 |
| ssj_ops@calibrated=48,505 |
| 100% |
100.0% |
48,505 |
48,525 |
| 90% |
89.5% |
43,655 |
43,412 |
| 80% |
80.4% |
38,804 |
39,008 |
| 70% |
69.5% |
33,954 |
33,722 |
| 60% |
59.9% |
29,103 |
29,078 |
| 50% |
50.0% |
24,253 |
24,247 |
| 40% |
39.9% |
19,402 |
19,341 |
| 30% |
30.6% |
14,552 |
14,860 |
| 20% |
20.1% |
9,701 |
9,750 |
| 10% |
10.3% |
4,851 |
5,004 |
| Active Idle |
|
0 |
0 |
JVM 'localhost.014' Scores:
| Target Load |
Actual Load |
ssj_ops |
| Target |
Actual |
| Calibration 1 |
|
|
46,876 |
| Calibration 2 |
|
|
48,265 |
| Calibration 3 |
|
|
48,369 |
| ssj_ops@calibrated=48,317 |
| 100% |
100.4% |
48,317 |
48,516 |
| 90% |
88.9% |
43,486 |
42,969 |
| 80% |
80.1% |
38,654 |
38,701 |
| 70% |
71.6% |
33,822 |
34,600 |
| 60% |
59.5% |
28,990 |
28,733 |
| 50% |
50.6% |
24,159 |
24,432 |
| 40% |
40.5% |
19,327 |
19,579 |
| 30% |
28.9% |
14,495 |
13,981 |
| 20% |
19.8% |
9,663 |
9,587 |
| 10% |
9.4% |
4,832 |
4,546 |
| Active Idle |
|
0 |
0 |
JVM 'localhost.015' Scores:
| Target Load |
Actual Load |
ssj_ops |
| Target |
Actual |
| Calibration 1 |
|
|
48,034 |
| Calibration 2 |
|
|
48,844 |
| Calibration 3 |
|
|
48,719 |
| ssj_ops@calibrated=48,781 |
| 100% |
98.7% |
48,781 |
48,153 |
| 90% |
89.8% |
43,903 |
43,820 |
| 80% |
79.0% |
39,025 |
38,560 |
| 70% |
69.6% |
34,147 |
33,958 |
| 60% |
60.4% |
29,269 |
29,487 |
| 50% |
50.1% |
24,391 |
24,418 |
| 40% |
40.4% |
19,512 |
19,711 |
| 30% |
30.2% |
14,634 |
14,725 |
| 20% |
20.5% |
9,756 |
9,979 |
| 10% |
9.7% |
4,878 |
4,754 |
| Active Idle |
|
0 |
0 |
JVM 'localhost.016' Scores:
| Target Load |
Actual Load |
ssj_ops |
| Target |
Actual |
| Calibration 1 |
|
|
47,063 |
| Calibration 2 |
|
|
47,540 |
| Calibration 3 |
|
|
47,573 |
| ssj_ops@calibrated=47,556 |
| 100% |
100.4% |
47,556 |
47,746 |
| 90% |
90.1% |
42,801 |
42,844 |
| 80% |
80.6% |
38,045 |
38,338 |
| 70% |
69.9% |
33,289 |
33,240 |
| 60% |
59.7% |
28,534 |
28,374 |
| 50% |
49.3% |
23,778 |
23,465 |
| 40% |
40.4% |
19,023 |
19,198 |
| 30% |
29.9% |
14,267 |
14,211 |
| 20% |
20.2% |
9,511 |
9,607 |
| 10% |
10.4% |
4,756 |
4,922 |
| Active Idle |
|
0 |
0 |
JVM 'localhost.017' Scores:
| Target Load |
Actual Load |
ssj_ops |
| Target |
Actual |
| Calibration 1 |
|
|
47,241 |
| Calibration 2 |
|
|
47,357 |
| Calibration 3 |
|
|
47,848 |
| ssj_ops@calibrated=47,603 |
| 100% |
99.6% |
47,603 |
47,416 |
| 90% |
89.6% |
42,842 |
42,673 |
| 80% |
80.7% |
38,082 |
38,395 |
| 70% |
70.6% |
33,322 |
33,625 |
| 60% |
61.0% |
28,562 |
29,052 |
| 50% |
49.8% |
23,801 |
23,688 |
| 40% |
41.0% |
19,041 |
19,522 |
| 30% |
29.8% |
14,281 |
14,163 |
| 20% |
20.2% |
9,521 |
9,597 |
| 10% |
10.3% |
4,760 |
4,902 |
| Active Idle |
|
0 |
0 |
JVM 'localhost.018' Scores:
| Target Load |
Actual Load |
ssj_ops |
| Target |
Actual |
| Calibration 1 |
|
|
47,173 |
| Calibration 2 |
|
|
48,291 |
| Calibration 3 |
|
|
48,314 |
| ssj_ops@calibrated=48,303 |
| 100% |
99.6% |
48,303 |
48,103 |
| 90% |
89.4% |
43,473 |
43,178 |
| 80% |
80.1% |
38,642 |
38,703 |
| 70% |
69.2% |
33,812 |
33,449 |
| 60% |
59.7% |
28,982 |
28,854 |
| 50% |
49.8% |
24,151 |
24,074 |
| 40% |
39.4% |
19,321 |
19,036 |
| 30% |
29.1% |
14,491 |
14,068 |
| 20% |
20.0% |
9,661 |
9,671 |
| 10% |
9.6% |
4,830 |
4,621 |
| Active Idle |
|
0 |
0 |
JVM 'localhost.019' Scores:
| Target Load |
Actual Load |
ssj_ops |
| Target |
Actual |
| Calibration 1 |
|
|
46,411 |
| Calibration 2 |
|
|
46,686 |
| Calibration 3 |
|
|
46,442 |
| ssj_ops@calibrated=46,564 |
| 100% |
97.4% |
46,564 |
45,334 |
| 90% |
89.1% |
41,908 |
41,490 |
| 80% |
80.0% |
37,251 |
37,271 |
| 70% |
70.7% |
32,595 |
32,908 |
| 60% |
59.4% |
27,938 |
27,659 |
| 50% |
49.9% |
23,282 |
23,221 |
| 40% |
38.8% |
18,626 |
18,071 |
| 30% |
30.2% |
13,969 |
14,062 |
| 20% |
20.1% |
9,313 |
9,364 |
| 10% |
9.5% |
4,656 |
4,442 |
| Active Idle |
|
0 |
0 |
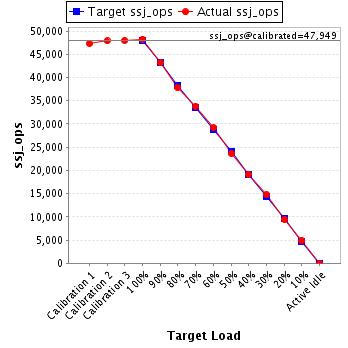
JVM 'localhost.020' Scores:
| Target Load |
Actual Load |
ssj_ops |
| Target |
Actual |
| Calibration 1 |
|
|
47,317 |
| Calibration 2 |
|
|
47,902 |
| Calibration 3 |
|
|
47,996 |
| ssj_ops@calibrated=47,949 |
| 100% |
100.7% |
47,949 |
48,274 |
| 90% |
90.1% |
43,154 |
43,188 |
| 80% |
78.8% |
38,359 |
37,807 |
| 70% |
70.5% |
33,565 |
33,812 |
| 60% |
60.9% |
28,770 |
29,180 |
| 50% |
49.3% |
23,975 |
23,627 |
| 40% |
40.0% |
19,180 |
19,160 |
| 30% |
30.8% |
14,385 |
14,758 |
| 20% |
19.7% |
9,590 |
9,470 |
| 10% |
10.1% |
4,795 |
4,858 |
| Active Idle |
|
0 |
0 |
JVM 'localhost.021' Scores:
| Target Load |
Actual Load |
ssj_ops |
| Target |
Actual |
| Calibration 1 |
|
|
46,321 |
| Calibration 2 |
|
|
47,631 |
| Calibration 3 |
|
|
47,270 |
| ssj_ops@calibrated=47,450 |
| 100% |
100.6% |
47,450 |
47,755 |
| 90% |
89.8% |
42,705 |
42,596 |
| 80% |
80.5% |
37,960 |
38,212 |
| 70% |
68.4% |
33,215 |
32,453 |
| 60% |
60.5% |
28,470 |
28,711 |
| 50% |
49.6% |
23,725 |
23,523 |
| 40% |
39.8% |
18,980 |
18,862 |
| 30% |
31.4% |
14,235 |
14,892 |
| 20% |
20.4% |
9,490 |
9,680 |
| 10% |
9.9% |
4,745 |
4,687 |
| Active Idle |
|
0 |
0 |
JVM 'localhost.022' Scores:
| Target Load |
Actual Load |
ssj_ops |
| Target |
Actual |
| Calibration 1 |
|
|
47,283 |
| Calibration 2 |
|
|
47,682 |
| Calibration 3 |
|
|
48,339 |
| ssj_ops@calibrated=48,011 |
| 100% |
99.5% |
48,011 |
47,778 |
| 90% |
90.0% |
43,210 |
43,214 |
| 80% |
80.6% |
38,408 |
38,675 |
| 70% |
70.2% |
33,607 |
33,718 |
| 60% |
60.5% |
28,806 |
29,025 |
| 50% |
50.2% |
24,005 |
24,120 |
| 40% |
39.3% |
19,204 |
18,876 |
| 30% |
30.6% |
14,403 |
14,708 |
| 20% |
19.9% |
9,602 |
9,561 |
| 10% |
9.9% |
4,801 |
4,742 |
| Active Idle |
|
0 |
0 |
JVM 'localhost.023' Scores:
| Target Load |
Actual Load |
ssj_ops |
| Target |
Actual |
| Calibration 1 |
|
|
47,069 |
| Calibration 2 |
|
|
47,569 |
| Calibration 3 |
|
|
47,958 |
| ssj_ops@calibrated=47,763 |
| 100% |
98.5% |
47,763 |
47,044 |
| 90% |
90.3% |
42,987 |
43,149 |
| 80% |
79.0% |
38,211 |
37,752 |
| 70% |
70.7% |
33,434 |
33,787 |
| 60% |
59.5% |
28,658 |
28,421 |
| 50% |
50.2% |
23,882 |
23,983 |
| 40% |
41.0% |
19,105 |
19,603 |
| 30% |
30.2% |
14,329 |
14,442 |
| 20% |
20.3% |
9,553 |
9,687 |
| 10% |
9.7% |
4,776 |
4,621 |
| Active Idle |
|
0 |
0 |
JVM 'localhost.024' Scores:
| Target Load |
Actual Load |
ssj_ops |
| Target |
Actual |
| Calibration 1 |
|
|
46,513 |
| Calibration 2 |
|
|
47,745 |
| Calibration 3 |
|
|
47,751 |
| ssj_ops@calibrated=47,748 |
| 100% |
99.0% |
47,748 |
47,271 |
| 90% |
90.4% |
42,974 |
43,161 |
| 80% |
78.5% |
38,199 |
37,491 |
| 70% |
68.6% |
33,424 |
32,770 |
| 60% |
59.7% |
28,649 |
28,509 |
| 50% |
48.9% |
23,874 |
23,356 |
| 40% |
39.7% |
19,099 |
18,948 |
| 30% |
29.4% |
14,325 |
14,017 |
| 20% |
20.4% |
9,550 |
9,745 |
| 10% |
9.6% |
4,775 |
4,590 |
| Active Idle |
|
0 |
0 |
JVM 'localhost.025' Scores:
| Target Load |
Actual Load |
ssj_ops |
| Target |
Actual |
| Calibration 1 |
|
|
46,983 |
| Calibration 2 |
|
|
47,874 |
| Calibration 3 |
|
|
47,436 |
| ssj_ops@calibrated=47,655 |
| 100% |
98.0% |
47,655 |
46,688 |
| 90% |
90.9% |
42,889 |
43,297 |
| 80% |
80.2% |
38,124 |
38,223 |
| 70% |
69.5% |
33,358 |
33,105 |
| 60% |
60.4% |
28,593 |
28,767 |
| 50% |
50.4% |
23,827 |
23,996 |
| 40% |
40.6% |
19,062 |
19,328 |
| 30% |
29.9% |
14,296 |
14,254 |
| 20% |
20.5% |
9,531 |
9,749 |
| 10% |
10.1% |
4,765 |
4,808 |
| Active Idle |
|
0 |
0 |
JVM 'localhost.026' Scores:
| Target Load |
Actual Load |
ssj_ops |
| Target |
Actual |
| Calibration 1 |
|
|
46,717 |
| Calibration 2 |
|
|
47,682 |
| Calibration 3 |
|
|
47,774 |
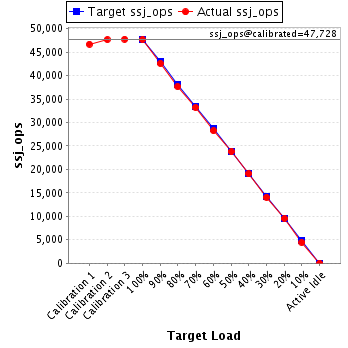
| ssj_ops@calibrated=47,728 |
| 100% |
99.9% |
47,728 |
47,687 |
| 90% |
89.2% |
42,955 |
42,592 |
| 80% |
78.9% |
38,182 |
37,662 |
| 70% |
69.6% |
33,410 |
33,206 |
| 60% |
59.2% |
28,637 |
28,237 |
| 50% |
49.8% |
23,864 |
23,787 |
| 40% |
39.9% |
19,091 |
19,057 |
| 30% |
29.5% |
14,318 |
14,075 |
| 20% |
20.0% |
9,546 |
9,537 |
| 10% |
9.3% |
4,773 |
4,458 |
| Active Idle |
|
0 |
0 |
JVM 'localhost.027' Scores:
| Target Load |
Actual Load |
ssj_ops |
| Target |
Actual |
| Calibration 1 |
|
|
47,750 |
| Calibration 2 |
|
|
48,457 |
| Calibration 3 |
|
|
48,768 |
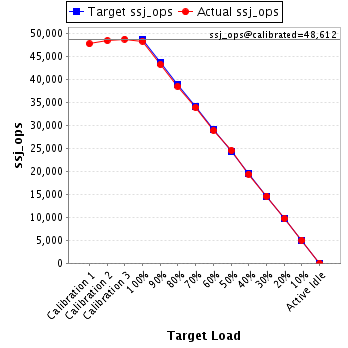
| ssj_ops@calibrated=48,612 |
| 100% |
99.5% |
48,612 |
48,352 |
| 90% |
89.0% |
43,751 |
43,257 |
| 80% |
79.2% |
38,890 |
38,504 |
| 70% |
69.7% |
34,029 |
33,888 |
| 60% |
59.5% |
29,167 |
28,906 |
| 50% |
50.5% |
24,306 |
24,558 |
| 40% |
39.9% |
19,445 |
19,399 |
| 30% |
30.1% |
14,584 |
14,612 |
| 20% |
20.0% |
9,722 |
9,708 |
| 10% |
10.3% |
4,861 |
4,996 |
| Active Idle |
|
0 |
0 |
JVM 'localhost.028' Scores:
| Target Load |
Actual Load |
ssj_ops |
| Target |
Actual |
| Calibration 1 |
|
|
46,772 |
| Calibration 2 |
|
|
47,767 |
| Calibration 3 |
|
|
48,198 |
| ssj_ops@calibrated=47,982 |
| 100% |
99.7% |
47,982 |
47,849 |
| 90% |
91.0% |
43,184 |
43,683 |
| 80% |
78.9% |
38,386 |
37,881 |
| 70% |
69.9% |
33,588 |
33,529 |
| 60% |
60.2% |
28,789 |
28,890 |
| 50% |
50.0% |
23,991 |
23,979 |
| 40% |
40.2% |
19,193 |
19,301 |
| 30% |
30.5% |
14,395 |
14,639 |
| 20% |
20.1% |
9,596 |
9,658 |
| 10% |
10.0% |
4,798 |
4,796 |
| Active Idle |
|
0 |
0 |
JVM 'localhost.029' Scores:
| Target Load |
Actual Load |
ssj_ops |
| Target |
Actual |
| Calibration 1 |
|
|
46,364 |
| Calibration 2 |
|
|
47,932 |
| Calibration 3 |
|
|
47,093 |
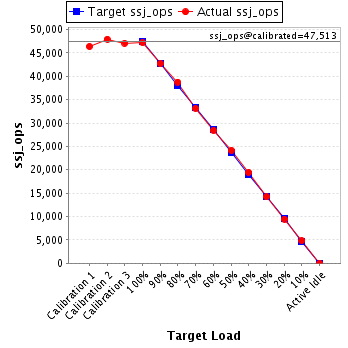
| ssj_ops@calibrated=47,513 |
| 100% |
99.4% |
47,513 |
47,212 |
| 90% |
89.9% |
42,761 |
42,703 |
| 80% |
81.6% |
38,010 |
38,759 |
| 70% |
69.8% |
33,259 |
33,140 |
| 60% |
59.8% |
28,508 |
28,429 |
| 50% |
50.8% |
23,756 |
24,154 |
| 40% |
40.9% |
19,005 |
19,445 |
| 30% |
29.9% |
14,254 |
14,196 |
| 20% |
19.9% |
9,503 |
9,454 |
| 10% |
10.2% |
4,751 |
4,854 |
| Active Idle |
|
0 |
0 |
JVM 'localhost.030' Scores:
| Target Load |
Actual Load |
ssj_ops |
| Target |
Actual |
| Calibration 1 |
|
|
47,291 |
| Calibration 2 |
|
|
47,981 |
| Calibration 3 |
|
|
48,163 |
| ssj_ops@calibrated=48,072 |
| 100% |
99.9% |
48,072 |
48,004 |
| 90% |
90.6% |
43,265 |
43,572 |
| 80% |
80.4% |
38,457 |
38,628 |
| 70% |
69.7% |
33,650 |
33,504 |
| 60% |
60.2% |
28,843 |
28,923 |
| 50% |
50.5% |
24,036 |
24,254 |
| 40% |
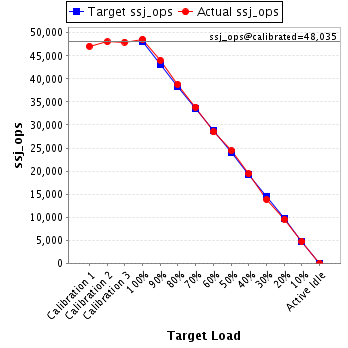
41.1% |
19,229 |
19,736 |
| 30% |
30.2% |
14,422 |
14,498 |
| 20% |
20.1% |
9,614 |
9,655 |
| 10% |
10.2% |
4,807 |
4,908 |
| Active Idle |
|
0 |
0 |
JVM 'localhost.031' Scores:
| Target Load |
Actual Load |
ssj_ops |
| Target |
Actual |
| Calibration 1 |
|
|
47,270 |
| Calibration 2 |
|
|
47,881 |
| Calibration 3 |
|
|
47,980 |
| ssj_ops@calibrated=47,931 |
| 100% |
99.4% |
47,931 |
47,634 |
| 90% |
90.1% |
43,137 |
43,200 |
| 80% |
80.0% |
38,344 |
38,366 |
| 70% |
70.8% |
33,551 |
33,947 |
| 60% |
60.3% |
28,758 |
28,909 |
| 50% |
50.0% |
23,965 |
23,969 |
| 40% |
40.3% |
19,172 |
19,299 |
| 30% |
30.0% |
14,379 |
14,362 |
| 20% |
19.3% |
9,586 |
9,246 |
| 10% |
9.9% |
4,793 |
4,769 |
| Active Idle |
|
0 |
0 |
JVM 'localhost.032' Scores:
| Target Load |
Actual Load |
ssj_ops |
| Target |
Actual |
| Calibration 1 |
|
|
47,061 |
| Calibration 2 |
|
|
48,819 |
| Calibration 3 |
|
|
48,630 |
| ssj_ops@calibrated=48,724 |
| 100% |
100.4% |
48,724 |
48,937 |
| 90% |
89.6% |
43,852 |
43,670 |
| 80% |
79.9% |
38,979 |
38,910 |
| 70% |
70.6% |
34,107 |
34,378 |
| 60% |
59.4% |
29,235 |
28,950 |
| 50% |
49.6% |
24,362 |
24,154 |
| 40% |
40.2% |
19,490 |
19,587 |
| 30% |
30.4% |
14,617 |
14,804 |
| 20% |
20.1% |
9,745 |
9,788 |
| 10% |
10.0% |
4,872 |
4,879 |
| Active Idle |
|
0 |
0 |
JVM 'localhost.033' Scores:
| Target Load |
Actual Load |
ssj_ops |
| Target |
Actual |
| Calibration 1 |
|
|
46,960 |
| Calibration 2 |
|
|
48,087 |
| Calibration 3 |
|
|
48,187 |
| ssj_ops@calibrated=48,137 |
| 100% |
99.4% |
48,137 |
47,843 |
| 90% |
90.5% |
43,323 |
43,543 |
| 80% |
80.7% |
38,510 |
38,841 |
| 70% |
71.3% |
33,696 |
34,332 |
| 60% |
59.8% |
28,882 |
28,786 |
| 50% |
51.2% |
24,069 |
24,650 |
| 40% |
41.0% |
19,255 |
19,721 |
| 30% |
29.6% |
14,441 |
14,254 |
| 20% |
19.8% |
9,627 |
9,525 |
| 10% |
9.9% |
4,814 |
4,767 |
| Active Idle |
|
0 |
0 |
JVM 'localhost.034' Scores:
| Target Load |
Actual Load |
ssj_ops |
| Target |
Actual |
| Calibration 1 |
|
|
46,075 |
| Calibration 2 |
|
|
46,611 |
| Calibration 3 |
|
|
46,821 |
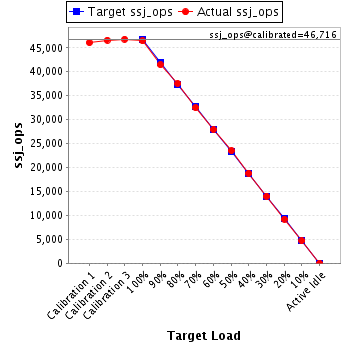
| ssj_ops@calibrated=46,716 |
| 100% |
99.5% |
46,716 |
46,461 |
| 90% |
88.8% |
42,044 |
41,473 |
| 80% |
80.4% |
37,373 |
37,571 |
| 70% |
69.5% |
32,701 |
32,484 |
| 60% |
59.8% |
28,030 |
27,950 |
| 50% |
50.4% |
23,358 |
23,532 |
| 40% |
40.3% |
18,686 |
18,811 |
| 30% |
30.0% |
14,015 |
14,037 |
| 20% |
19.8% |
9,343 |
9,229 |
| 10% |
10.1% |
4,672 |
4,697 |
| Active Idle |
|
0 |
0 |
JVM 'localhost.035' Scores:
| Target Load |
Actual Load |
ssj_ops |
| Target |
Actual |
| Calibration 1 |
|
|
47,122 |
| Calibration 2 |
|
|
48,071 |
| Calibration 3 |
|
|
47,999 |
| ssj_ops@calibrated=48,035 |
| 100% |
101.2% |
48,035 |
48,619 |
| 90% |
91.7% |
43,231 |
44,026 |
| 80% |
80.8% |
38,428 |
38,812 |
| 70% |
70.6% |
33,624 |
33,901 |
| 60% |
59.3% |
28,821 |
28,479 |
| 50% |
50.9% |
24,017 |
24,450 |
| 40% |
40.4% |
19,214 |
19,400 |
| 30% |
28.8% |
14,410 |
13,843 |
| 20% |
19.8% |
9,607 |
9,512 |
| 10% |
9.9% |
4,803 |
4,733 |
| Active Idle |
|
0 |
0 |
JVM 'localhost.036' Scores:
| Target Load |
Actual Load |
ssj_ops |
| Target |
Actual |
| Calibration 1 |
|
|
47,952 |
| Calibration 2 |
|
|
47,746 |
| Calibration 3 |
|
|
48,446 |
| ssj_ops@calibrated=48,096 |
| 100% |
99.3% |
48,096 |
47,750 |
| 90% |
89.1% |
43,287 |
42,857 |
| 80% |
82.5% |
38,477 |
39,695 |
| 70% |
68.8% |
33,667 |
33,096 |
| 60% |
60.3% |
28,858 |
28,985 |
| 50% |
49.4% |
24,048 |
23,772 |
| 40% |
40.0% |
19,238 |
19,225 |
| 30% |
31.3% |
14,429 |
15,037 |
| 20% |
20.0% |
9,619 |
9,633 |
| 10% |
9.9% |
4,810 |
4,762 |
| Active Idle |
|
0 |
0 |
JVM 'localhost.037' Scores:
| Target Load |
Actual Load |
ssj_ops |
| Target |
Actual |
| Calibration 1 |
|
|
45,885 |
| Calibration 2 |
|
|
47,820 |
| Calibration 3 |
|
|
47,645 |
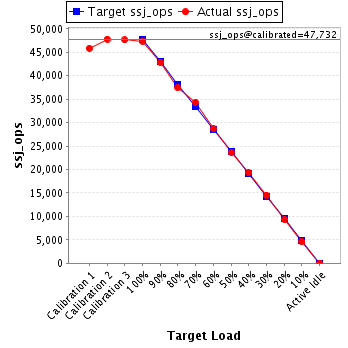
| ssj_ops@calibrated=47,732 |
| 100% |
99.4% |
47,732 |
47,422 |
| 90% |
89.8% |
42,959 |
42,855 |
| 80% |
78.5% |
38,186 |
37,473 |
| 70% |
72.0% |
33,413 |
34,346 |
| 60% |
60.1% |
28,639 |
28,677 |
| 50% |
49.5% |
23,866 |
23,618 |
| 40% |
40.6% |
19,093 |
19,368 |
| 30% |
30.5% |
14,320 |
14,542 |
| 20% |
19.8% |
9,546 |
9,431 |
| 10% |
9.8% |
4,773 |
4,671 |
| Active Idle |
|
0 |
0 |
JVM 'localhost.038' Scores:
| Target Load |
Actual Load |
ssj_ops |
| Target |
Actual |
| Calibration 1 |
|
|
47,504 |
| Calibration 2 |
|
|
48,384 |
| Calibration 3 |
|
|
48,325 |
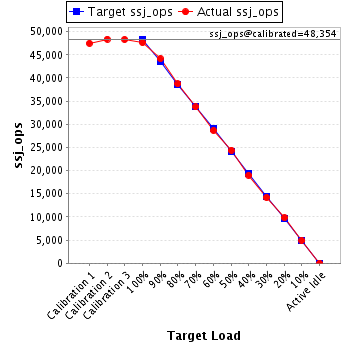
| ssj_ops@calibrated=48,354 |
| 100% |
98.5% |
48,354 |
47,627 |
| 90% |
91.4% |
43,519 |
44,185 |
| 80% |
80.1% |
38,683 |
38,740 |
| 70% |
69.8% |
33,848 |
33,749 |
| 60% |
59.4% |
29,013 |
28,703 |
| 50% |
50.5% |
24,177 |
24,400 |
| 40% |
39.3% |
19,342 |
18,992 |
| 30% |
29.4% |
14,506 |
14,208 |
| 20% |
20.3% |
9,671 |
9,817 |
| 10% |
10.2% |
4,835 |
4,912 |
| Active Idle |
|
0 |
0 |
JVM 'localhost.039' Scores:
| Target Load |
Actual Load |
ssj_ops |
| Target |
Actual |
| Calibration 1 |
|
|
46,402 |
| Calibration 2 |
|
|
47,632 |
| Calibration 3 |
|
|
47,565 |
| ssj_ops@calibrated=47,599 |
| 100% |
100.0% |
47,599 |
47,614 |
| 90% |
90.5% |
42,839 |
43,093 |
| 80% |
80.4% |
38,079 |
38,250 |
| 70% |
69.7% |
33,319 |
33,199 |
| 60% |
60.5% |
28,559 |
28,792 |
| 50% |
50.4% |
23,799 |
23,971 |
| 40% |
39.3% |
19,039 |
18,728 |
| 30% |
30.0% |
14,280 |
14,267 |
| 20% |
19.7% |
9,520 |
9,377 |
| 10% |
9.8% |
4,760 |
4,675 |
| Active Idle |
|
0 |
0 |
JVM 'localhost.040' Scores:
| Target Load |
Actual Load |
ssj_ops |
| Target |
Actual |
| Calibration 1 |
|
|
46,498 |
| Calibration 2 |
|
|
47,833 |
| Calibration 3 |
|
|
47,591 |
| ssj_ops@calibrated=47,712 |
| 100% |
99.7% |
47,712 |
47,580 |
| 90% |
91.4% |
42,941 |
43,632 |
| 80% |
78.6% |
38,170 |
37,525 |
| 70% |
70.1% |
33,399 |
33,467 |
| 60% |
60.7% |
28,627 |
28,958 |
| 50% |
49.6% |
23,856 |
23,652 |
| 40% |
39.2% |
19,085 |
18,687 |
| 30% |
30.3% |
14,314 |
14,480 |
| 20% |
19.6% |
9,542 |
9,375 |
| 10% |
10.0% |
4,771 |
4,758 |
| Active Idle |
|
0 |
0 |
JVM 'localhost.041' Scores:
| Target Load |
Actual Load |
ssj_ops |
| Target |
Actual |
| Calibration 1 |
|
|
47,192 |
| Calibration 2 |
|
|
48,844 |
| Calibration 3 |
|
|
48,905 |
| ssj_ops@calibrated=48,875 |
| 100% |
98.7% |
48,875 |
48,226 |
| 90% |
90.0% |
43,987 |
43,980 |
| 80% |
79.5% |
39,100 |
38,872 |
| 70% |
71.3% |
34,212 |
34,851 |
| 60% |
58.7% |
29,325 |
28,692 |
| 50% |
50.7% |
24,437 |
24,789 |
| 40% |
39.5% |
19,550 |
19,313 |
| 30% |
29.4% |
14,662 |
14,374 |
| 20% |
20.2% |
9,775 |
9,854 |
| 10% |
10.8% |
4,887 |
5,267 |
| Active Idle |
|
0 |
0 |
JVM 'localhost.042' Scores:
| Target Load |
Actual Load |
ssj_ops |
| Target |
Actual |
| Calibration 1 |
|
|
47,404 |
| Calibration 2 |
|
|
48,157 |
| Calibration 3 |
|
|
48,303 |
| ssj_ops@calibrated=48,230 |
| 100% |
100.3% |
48,230 |
48,359 |
| 90% |
90.4% |
43,407 |
43,620 |
| 80% |
80.7% |
38,584 |
38,938 |
| 70% |
69.5% |
33,761 |
33,504 |
| 60% |
59.5% |
28,938 |
28,701 |
| 50% |
51.6% |
24,115 |
24,879 |
| 40% |
40.1% |
19,292 |
19,347 |
| 30% |
29.8% |
14,469 |
14,350 |
| 20% |
20.3% |
9,646 |
9,775 |
| 10% |
9.8% |
4,823 |
4,746 |
| Active Idle |
|
0 |
0 |
JVM 'localhost.043' Scores:
| Target Load |
Actual Load |
ssj_ops |
| Target |
Actual |
| Calibration 1 |
|
|
46,565 |
| Calibration 2 |
|
|
47,995 |
| Calibration 3 |
|
|
47,418 |
| ssj_ops@calibrated=47,707 |
| 100% |
100.8% |
47,707 |
48,111 |
| 90% |
90.1% |
42,936 |
42,993 |
| 80% |
77.8% |
38,165 |
37,137 |
| 70% |
71.4% |
33,395 |
34,066 |
| 60% |
59.8% |
28,624 |
28,551 |
| 50% |
50.3% |
23,853 |
23,984 |
| 40% |
40.5% |
19,083 |
19,326 |
| 30% |
30.2% |
14,312 |
14,429 |
| 20% |
20.2% |
9,541 |
9,654 |
| 10% |
9.8% |
4,771 |
4,692 |
| Active Idle |
|
0 |
0 |
JVM 'localhost.044' Scores:
| Target Load |
Actual Load |
ssj_ops |
| Target |
Actual |
| Calibration 1 |
|
|
47,445 |
| Calibration 2 |
|
|
48,133 |
| Calibration 3 |
|
|
48,593 |
| ssj_ops@calibrated=48,363 |
| 100% |
98.9% |
48,363 |
47,815 |
| 90% |
88.6% |
43,526 |
42,831 |
| 80% |
78.6% |
38,690 |
38,036 |
| 70% |
69.3% |
33,854 |
33,502 |
| 60% |
59.7% |
29,018 |
28,852 |
| 50% |
49.7% |
24,181 |
24,040 |
| 40% |
40.5% |
19,345 |
19,596 |
| 30% |
29.7% |
14,509 |
14,368 |
| 20% |
20.3% |
9,673 |
9,839 |
| 10% |
10.1% |
4,836 |
4,867 |
| Active Idle |
|
0 |
0 |
JVM 'localhost.045' Scores:
| Target Load |
Actual Load |
ssj_ops |
| Target |
Actual |
| Calibration 1 |
|
|
47,536 |
| Calibration 2 |
|
|
48,536 |
| Calibration 3 |
|
|
47,977 |
| ssj_ops@calibrated=48,257 |
| 100% |
101.0% |
48,257 |
48,741 |
| 90% |
89.4% |
43,431 |
43,161 |
| 80% |
80.9% |
38,605 |
39,047 |
| 70% |
70.1% |
33,780 |
33,840 |
| 60% |
61.1% |
28,954 |
29,461 |
| 50% |
50.3% |
24,128 |
24,277 |
| 40% |
39.0% |
19,303 |
18,818 |
| 30% |
30.1% |
14,477 |
14,542 |
| 20% |
21.0% |
9,651 |
10,129 |
| 10% |
10.1% |
4,826 |
4,871 |
| Active Idle |
|
0 |
0 |
JVM 'localhost.046' Scores:
| Target Load |
Actual Load |
ssj_ops |
| Target |
Actual |
| Calibration 1 |
|
|
47,280 |
| Calibration 2 |
|
|
47,962 |
| Calibration 3 |
|
|
48,051 |
| ssj_ops@calibrated=48,006 |
| 100% |
99.4% |
48,006 |
47,730 |
| 90% |
89.1% |
43,206 |
42,774 |
| 80% |
79.1% |
38,405 |
37,959 |
| 70% |
70.0% |
33,604 |
33,595 |
| 60% |
61.1% |
28,804 |
29,321 |
| 50% |
50.3% |
24,003 |
24,136 |
| 40% |
39.3% |
19,203 |
18,879 |
| 30% |
31.1% |
14,402 |
14,921 |
| 20% |
19.8% |
9,601 |
9,504 |
| 10% |
10.1% |
4,801 |
4,852 |
| Active Idle |
|
0 |
0 |
JVM 'localhost.047' Scores:
| Target Load |
Actual Load |
ssj_ops |
| Target |
Actual |
| Calibration 1 |
|
|
47,135 |
| Calibration 2 |
|
|
48,258 |
| Calibration 3 |
|
|
47,685 |
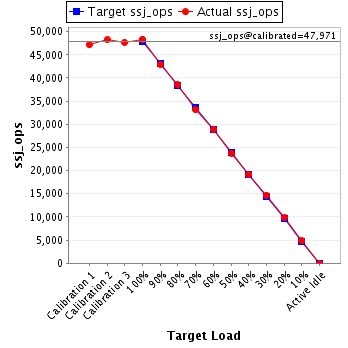
| ssj_ops@calibrated=47,971 |
| 100% |
100.8% |
47,971 |
48,379 |
| 90% |
89.5% |
43,174 |
42,941 |
| 80% |
80.3% |
38,377 |
38,501 |
| 70% |
69.1% |
33,580 |
33,125 |
| 60% |
60.3% |
28,783 |
28,951 |
| 50% |
49.6% |
23,986 |
23,771 |
| 40% |
40.1% |
19,189 |
19,246 |
| 30% |
30.6% |
14,391 |
14,689 |
| 20% |
20.4% |
9,594 |
9,779 |
| 10% |
10.2% |
4,797 |
4,887 |
| Active Idle |
|
0 |
0 |
JVM 'localhost.048' Scores:
| Target Load |
Actual Load |
ssj_ops |
| Target |
Actual |
| Calibration 1 |
|
|
46,679 |
| Calibration 2 |
|
|
48,285 |
| Calibration 3 |
|
|
47,817 |
| ssj_ops@calibrated=48,051 |
| 100% |
98.9% |
48,051 |
47,501 |
| 90% |
91.8% |
43,246 |
44,106 |
| 80% |
79.8% |
38,440 |
38,323 |
| 70% |
70.3% |
33,635 |
33,767 |
| 60% |
59.2% |
28,830 |
28,440 |
| 50% |
51.3% |
24,025 |
24,633 |
| 40% |
39.7% |
19,220 |
19,096 |
| 30% |
30.6% |
14,415 |
14,713 |
| 20% |
20.2% |
9,610 |
9,716 |
| 10% |
9.8% |
4,805 |
4,692 |
| Active Idle |
|
0 |
0 |