SPECpower_ssj2008
Host 'node1' Performance Report
Copyright © 2007-2020 Standard Performance Evaluation Corporation
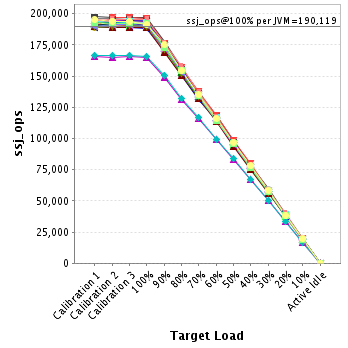
| ASUSTeK Computer Inc. RS620SA-E10-RS12 | ssj_ops@100% = 6,083,814 ssj_ops@100% per JVM = 190,119 |
||||
| Test Sponsor: | ASUSTeK Computer Inc. | SPEC License #: | 9016 | Test Method: | Multi Node |
| Tested By: | ASUSTeK Computer Inc. | Test Location: | Taipei, Taiwan. | Test Date: | Sep 18, 2020 |
| Hardware Availability: | Sep-2020 | Software Availability: | Jul-2020 | Publication: | Oct 7, 2020 |
| System Source: | Single Supplier | System Designation: | Server | Power Provisioning: | Line-powered |
| Target Load | Actual Load | ssj_ops | |
|---|---|---|---|
| Target | Actual | ||
| Calibration 1 | 6,094,744 | ||
| Calibration 2 | 6,099,855 | ||
| Calibration 3 | 6,105,618 | ||
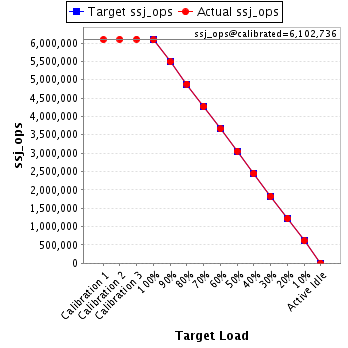
| ssj_ops@calibrated=6,102,736 | |||
| 100% | 99.7% | 6,102,736 | 6,083,814 |
| 90% | 90.0% | 5,492,463 | 5,491,256 |
| 80% | 80.0% | 4,882,189 | 4,882,486 |
| 70% | 70.0% | 4,271,915 | 4,271,097 |
| 60% | 59.9% | 3,661,642 | 3,658,248 |
| 50% | 50.1% | 3,051,368 | 3,054,927 |
| 40% | 40.0% | 2,441,095 | 2,443,879 |
| 30% | 30.0% | 1,830,821 | 1,829,000 |
| 20% | 20.0% | 1,220,547 | 1,222,013 |
| 10% | 10.0% | 610,274 | 611,682 |
| Active Idle | 0 | 0 | |
| Set Identifier: | RS620SA-E10-RS12 |
| Set Description: | System Under Test |
| # of Identical Nodes: | 6 |
| Comment: | 'SUT' |
| Hardware | |
|---|---|
| Hardware Vendor: | ASUSTeK Computer Inc. |
| Model: | RS620SA-E10-RS12 |
| Form Factor: | 1U |
| CPU Name: | AMD EPYC 7742 2.25Ghz |
| CPU Characteristics: | 64-Core, 2.25GHz, 256MB L3 Cache |
| CPU Frequency (MHz): | 2250 |
| CPU(s) Enabled: | 64 cores, 1 chip, 64 cores/chip |
| Hardware Threads: | 128 (2 / core) |
| CPU(s) Orderable: | 1 chip |
| Primary Cache: | 32 KB I + 32 KB D on chip per core |
| Secondary Cache: | 512 KB I+D on chip per core |
| Tertiary Cache: | 256 MB I+D on chip per chip, 16 MB shared / 4 cores |
| Other Cache: | None |
| Memory Amount (GB): | 128 |
| # and size of DIMM: | 8 x 16 GB |
| Memory Details: | 8 x 16GB 2Rx8 PC4-3200AA-R ECC RDIMM; all slots populated |
| Power Supply Quantity and Rating (W): | None |
| Power Supply Details: | Shared |
| Disk Drive: | 1 x 240GB Seagate Nytro 510DCT M.2 PCIE SSD P/N: 03B03-00130200 |
| Disk Controller: | Integrated PCIE controller |
| # and type of Network Interface Cards (NICs) Installed: | 1 x Intel I210 Gigabit Ethernet controller |
| NICs Enabled in Firmware / OS / Connected: | 1/1/1 |
| Network Speed (Mbit): | 1000 |
| Keyboard: | None |
| Mouse: | None |
| Monitor: | None |
| Optical Drives: | No |
| Other Hardware: | None |
| Software | |
|---|---|
| Power Management: | Enabled(See SUT Notes) |
| Operating System (OS): | Suse Linux Enterprise Server 15 SP1 |
| OS Version: | 4.12.14-195-default |
| Filesystem: | xfs |
| JVM Vendor: | Oracle |
| JVM Version: | Java HotSpot(TM) 64-Bit Server VM (build 14.0.2+12-46, mixed mode, sharing), version 14.0.2 |
| JVM Command-line Options: | -server -Xmn1200m -Xms1400m -Xmx1400m -XX:MaxTenuringThreshold=1 -XX:ParallelGCThreads=2 -XX:InlineSmallCode=4000 -XX:MaxInlineSize=300 -XX:FreqInlineSize=3000 -XX:+UseParallelGC -XX:+UseLargePages -XX:+UseHugeTLBFS -XX:+UseTransparentHugePages |
| JVM Affinity: | for each two physicalCores { numactl -C physicalCoreId, physicalCoreId + 1, physicalCoreId + 64, physicalCoreId + 65 -l } |
| JVM Instances: | 32 |
| JVM Initial Heap (MB): | 1400 |
| JVM Maximum Heap (MB): | 1400 |
| JVM Address Bits: | 64 |
| Boot Firmware Version: | 0305 |
| Management Firmware Version: | 2.1.09 |
| Workload Version: | SSJ 1.2.10 |
| Director Location: | Controller |
| Other Software: | None |
| JVM Instance | ssj_ops@100% |
|---|---|
| node1.001 | 189,969 |
| node1.002 | 191,326 |
| node1.003 | 193,678 |
| node1.004 | 189,523 |
| node1.005 | 193,792 |
| node1.006 | 191,799 |
| node1.007 | 191,669 |
| node1.008 | 195,908 |
| node1.009 | 192,221 |
| node1.010 | 188,353 |
| node1.011 | 191,067 |
| node1.012 | 189,822 |
| node1.013 | 164,888 |
| node1.014 | 165,633 |
| node1.015 | 196,756 |
| node1.016 | 196,074 |
| node1.017 | 194,525 |
| node1.018 | 189,018 |
| node1.019 | 191,052 |
| node1.020 | 188,591 |
| node1.021 | 192,650 |
| node1.022 | 192,414 |
| node1.023 | 188,935 |
| node1.024 | 190,412 |
| node1.025 | 189,893 |
| node1.026 | 189,436 |
| node1.027 | 193,463 |
| node1.028 | 191,905 |
| node1.029 | 195,061 |
| node1.030 | 190,619 |
| node1.031 | 191,890 |
| node1.032 | 191,471 |
| ssj_ops@100% | 6,083,814 |
| ssj_ops@100% per JVM | 190,119 |
| Target Load | Actual Load | ssj_ops | |
|---|---|---|---|
| Target | Actual | ||
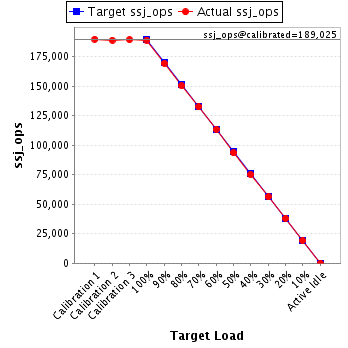
| Calibration 1 | 192,049 | ||
| Calibration 2 | 190,077 | ||
| Calibration 3 | 190,207 | ||
| ssj_ops@calibrated=190,142 | |||
| 100% | 99.9% | 190,142 | 189,969 |
| 90% | 89.6% | 171,128 | 170,425 |
| 80% | 80.0% | 152,114 | 152,172 |
| 70% | 69.9% | 133,100 | 132,909 |
| 60% | 59.8% | 114,085 | 113,694 |
| 50% | 50.1% | 95,071 | 95,315 |
| 40% | 40.0% | 76,057 | 76,034 |
| 30% | 30.4% | 57,043 | 57,713 |
| 20% | 20.0% | 38,028 | 38,121 |
| 10% | 10.0% | 19,014 | 18,953 |
| Active Idle | 0 | 0 | |

| Target Load | Actual Load | ssj_ops | |
|---|---|---|---|
| Target | Actual | ||
| Calibration 1 | 189,911 | ||
| Calibration 2 | 191,244 | ||
| Calibration 3 | 191,660 | ||
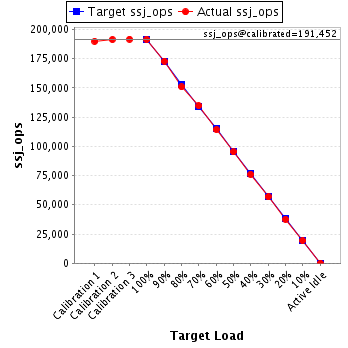
| ssj_ops@calibrated=191,452 | |||
| 100% | 99.9% | 191,452 | 191,326 |
| 90% | 90.3% | 172,307 | 172,896 |
| 80% | 78.7% | 153,162 | 150,768 |
| 70% | 70.4% | 134,016 | 134,733 |
| 60% | 59.7% | 114,871 | 114,294 |
| 50% | 49.7% | 95,726 | 95,186 |
| 40% | 39.7% | 76,581 | 76,067 |
| 30% | 29.7% | 57,436 | 56,827 |
| 20% | 19.7% | 38,290 | 37,650 |
| 10% | 10.1% | 19,145 | 19,344 |
| Active Idle | 0 | 0 | |
| Target Load | Actual Load | ssj_ops | |
|---|---|---|---|
| Target | Actual | ||
| Calibration 1 | 194,665 | ||
| Calibration 2 | 193,499 | ||
| Calibration 3 | 193,592 | ||
| ssj_ops@calibrated=193,545 | |||
| 100% | 100.1% | 193,545 | 193,678 |
| 90% | 89.9% | 174,191 | 173,989 |
| 80% | 80.2% | 154,836 | 155,134 |
| 70% | 70.1% | 135,482 | 135,581 |
| 60% | 59.9% | 116,127 | 115,980 |
| 50% | 50.0% | 96,773 | 96,790 |
| 40% | 40.5% | 77,418 | 78,450 |
| 30% | 29.6% | 58,064 | 57,345 |
| 20% | 20.0% | 38,709 | 38,742 |
| 10% | 9.9% | 19,355 | 19,150 |
| Active Idle | 0 | 0 | |

| Target Load | Actual Load | ssj_ops | |
|---|---|---|---|
| Target | Actual | ||
| Calibration 1 | 189,223 | ||
| Calibration 2 | 189,285 | ||
| Calibration 3 | 190,233 | ||
| ssj_ops@calibrated=189,759 | |||
| 100% | 99.9% | 189,759 | 189,523 |
| 90% | 90.5% | 170,783 | 171,670 |
| 80% | 80.4% | 151,807 | 152,635 |
| 70% | 70.3% | 132,831 | 133,419 |
| 60% | 60.2% | 113,855 | 114,260 |
| 50% | 50.0% | 94,880 | 94,963 |
| 40% | 39.7% | 75,904 | 75,256 |
| 30% | 29.9% | 56,928 | 56,665 |
| 20% | 20.3% | 37,952 | 38,489 |
| 10% | 10.2% | 18,976 | 19,279 |
| Active Idle | 0 | 0 | |

| Target Load | Actual Load | ssj_ops | |
|---|---|---|---|
| Target | Actual | ||
| Calibration 1 | 194,447 | ||
| Calibration 2 | 194,329 | ||
| Calibration 3 | 194,193 | ||
| ssj_ops@calibrated=194,261 | |||
| 100% | 99.8% | 194,261 | 193,792 |
| 90% | 89.7% | 174,835 | 174,227 |
| 80% | 79.9% | 155,409 | 155,203 |
| 70% | 69.7% | 135,983 | 135,458 |
| 60% | 60.5% | 116,557 | 117,531 |
| 50% | 50.3% | 97,130 | 97,739 |
| 40% | 40.0% | 77,704 | 77,612 |
| 30% | 29.7% | 58,278 | 57,713 |
| 20% | 20.0% | 38,852 | 38,829 |
| 10% | 10.1% | 19,426 | 19,562 |
| Active Idle | 0 | 0 | |

| Target Load | Actual Load | ssj_ops | |
|---|---|---|---|
| Target | Actual | ||
| Calibration 1 | 193,799 | ||
| Calibration 2 | 193,197 | ||
| Calibration 3 | 192,836 | ||
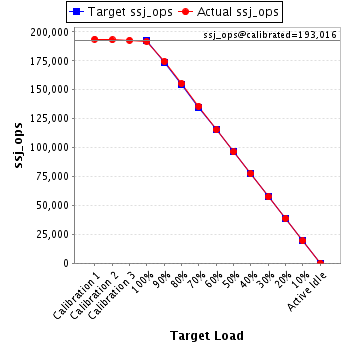
| ssj_ops@calibrated=193,016 | |||
| 100% | 99.4% | 193,016 | 191,799 |
| 90% | 90.5% | 173,715 | 174,609 |
| 80% | 80.5% | 154,413 | 155,420 |
| 70% | 70.3% | 135,111 | 135,771 |
| 60% | 59.8% | 115,810 | 115,450 |
| 50% | 49.9% | 96,508 | 96,259 |
| 40% | 40.1% | 77,206 | 77,384 |
| 30% | 29.8% | 57,905 | 57,428 |
| 20% | 20.1% | 38,603 | 38,831 |
| 10% | 10.0% | 19,302 | 19,392 |
| Active Idle | 0 | 0 | |
| Target Load | Actual Load | ssj_ops | |
|---|---|---|---|
| Target | Actual | ||
| Calibration 1 | 190,917 | ||
| Calibration 2 | 191,751 | ||
| Calibration 3 | 192,206 | ||
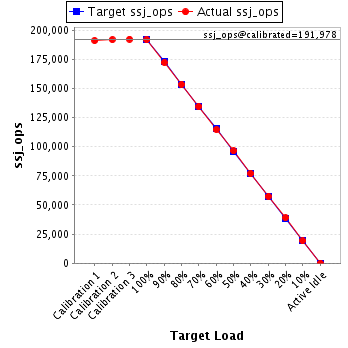
| ssj_ops@calibrated=191,978 | |||
| 100% | 99.8% | 191,978 | 191,669 |
| 90% | 89.7% | 172,780 | 172,172 |
| 80% | 79.9% | 153,583 | 153,414 |
| 70% | 70.0% | 134,385 | 134,427 |
| 60% | 59.7% | 115,187 | 114,594 |
| 50% | 50.2% | 95,989 | 96,328 |
| 40% | 40.1% | 76,791 | 77,021 |
| 30% | 29.9% | 57,593 | 57,410 |
| 20% | 20.3% | 38,396 | 38,933 |
| 10% | 10.0% | 19,198 | 19,195 |
| Active Idle | 0 | 0 | |
| Target Load | Actual Load | ssj_ops | |
|---|---|---|---|
| Target | Actual | ||
| Calibration 1 | 196,249 | ||
| Calibration 2 | 196,061 | ||
| Calibration 3 | 195,515 | ||
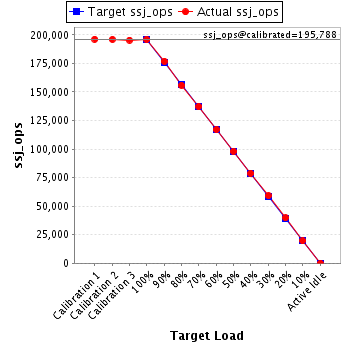
| ssj_ops@calibrated=195,788 | |||
| 100% | 100.1% | 195,788 | 195,908 |
| 90% | 90.3% | 176,209 | 176,894 |
| 80% | 79.6% | 156,630 | 155,852 |
| 70% | 70.1% | 137,051 | 137,286 |
| 60% | 59.8% | 117,473 | 117,092 |
| 50% | 50.2% | 97,894 | 98,211 |
| 40% | 40.3% | 78,315 | 78,871 |
| 30% | 30.2% | 58,736 | 59,082 |
| 20% | 20.3% | 39,158 | 39,660 |
| 10% | 10.0% | 19,579 | 19,596 |
| Active Idle | 0 | 0 | |
| Target Load | Actual Load | ssj_ops | |
|---|---|---|---|
| Target | Actual | ||
| Calibration 1 | 190,655 | ||
| Calibration 2 | 192,009 | ||
| Calibration 3 | 191,670 | ||
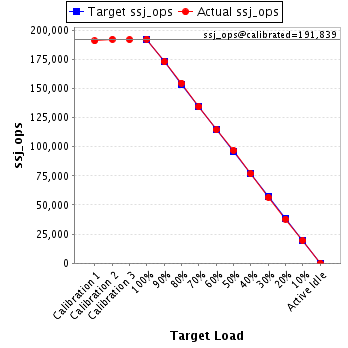
| ssj_ops@calibrated=191,839 | |||
| 100% | 100.2% | 191,839 | 192,221 |
| 90% | 90.1% | 172,656 | 172,799 |
| 80% | 80.6% | 153,472 | 154,584 |
| 70% | 70.0% | 134,288 | 134,232 |
| 60% | 59.7% | 115,104 | 114,517 |
| 50% | 50.5% | 95,920 | 96,864 |
| 40% | 40.0% | 76,736 | 76,703 |
| 30% | 29.5% | 57,552 | 56,559 |
| 20% | 19.8% | 38,368 | 37,918 |
| 10% | 10.2% | 19,184 | 19,547 |
| Active Idle | 0 | 0 | |
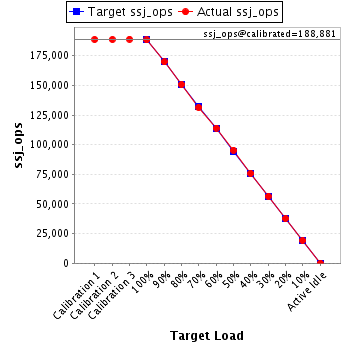
| Target Load | Actual Load | ssj_ops | |
|---|---|---|---|
| Target | Actual | ||
| Calibration 1 | 188,692 | ||
| Calibration 2 | 188,750 | ||
| Calibration 3 | 189,013 | ||
| ssj_ops@calibrated=188,881 | |||
| 100% | 99.7% | 188,881 | 188,353 |
| 90% | 89.9% | 169,993 | 169,760 |
| 80% | 79.8% | 151,105 | 150,814 |
| 70% | 69.6% | 132,217 | 131,421 |
| 60% | 60.4% | 113,329 | 114,060 |
| 50% | 50.5% | 94,441 | 95,463 |
| 40% | 40.2% | 75,553 | 75,859 |
| 30% | 29.9% | 56,664 | 56,497 |
| 20% | 19.9% | 37,776 | 37,675 |
| 10% | 10.2% | 18,888 | 19,283 |
| Active Idle | 0 | 0 | |
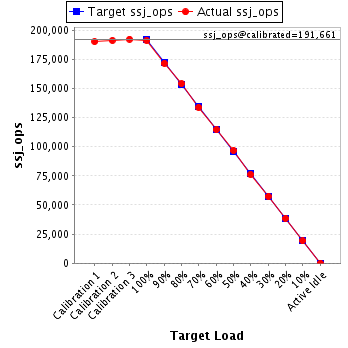
| Target Load | Actual Load | ssj_ops | |
|---|---|---|---|
| Target | Actual | ||
| Calibration 1 | 190,167 | ||
| Calibration 2 | 191,097 | ||
| Calibration 3 | 192,225 | ||
| ssj_ops@calibrated=191,661 | |||
| 100% | 99.7% | 191,661 | 191,067 |
| 90% | 89.4% | 172,495 | 171,429 |
| 80% | 80.3% | 153,329 | 153,980 |
| 70% | 69.8% | 134,163 | 133,706 |
| 60% | 59.8% | 114,997 | 114,623 |
| 50% | 50.4% | 95,831 | 96,678 |
| 40% | 39.7% | 76,664 | 76,147 |
| 30% | 29.9% | 57,498 | 57,376 |
| 20% | 20.1% | 38,332 | 38,537 |
| 10% | 10.0% | 19,166 | 19,187 |
| Active Idle | 0 | 0 | |
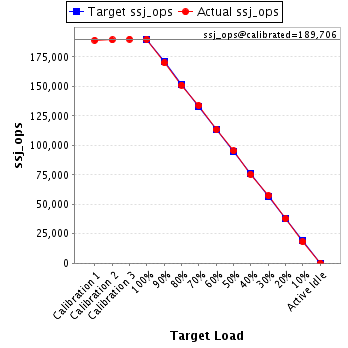
| Target Load | Actual Load | ssj_ops | |
|---|---|---|---|
| Target | Actual | ||
| Calibration 1 | 189,070 | ||
| Calibration 2 | 189,376 | ||
| Calibration 3 | 190,037 | ||
| ssj_ops@calibrated=189,706 | |||
| 100% | 100.1% | 189,706 | 189,822 |
| 90% | 89.6% | 170,736 | 170,036 |
| 80% | 79.7% | 151,765 | 151,156 |
| 70% | 70.5% | 132,794 | 133,786 |
| 60% | 59.8% | 113,824 | 113,395 |
| 50% | 50.2% | 94,853 | 95,225 |
| 40% | 39.7% | 75,882 | 75,290 |
| 30% | 30.2% | 56,912 | 57,290 |
| 20% | 19.9% | 37,941 | 37,790 |
| 10% | 9.6% | 18,971 | 18,235 |
| Active Idle | 0 | 0 | |
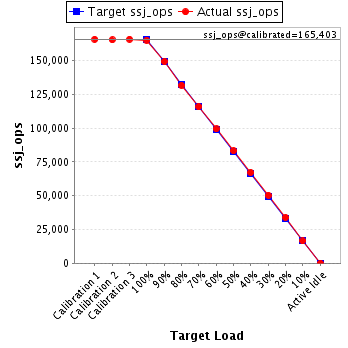
| Target Load | Actual Load | ssj_ops | |
|---|---|---|---|
| Target | Actual | ||
| Calibration 1 | 165,645 | ||
| Calibration 2 | 165,113 | ||
| Calibration 3 | 165,693 | ||
| ssj_ops@calibrated=165,403 | |||
| 100% | 99.7% | 165,403 | 164,888 |
| 90% | 90.2% | 148,863 | 149,165 |
| 80% | 79.5% | 132,323 | 131,513 |
| 70% | 70.0% | 115,782 | 115,769 |
| 60% | 60.0% | 99,242 | 99,311 |
| 50% | 50.2% | 82,702 | 83,063 |
| 40% | 40.6% | 66,161 | 67,170 |
| 30% | 30.4% | 49,621 | 50,329 |
| 20% | 20.5% | 33,081 | 33,867 |
| 10% | 10.0% | 16,540 | 16,471 |
| Active Idle | 0 | 0 | |
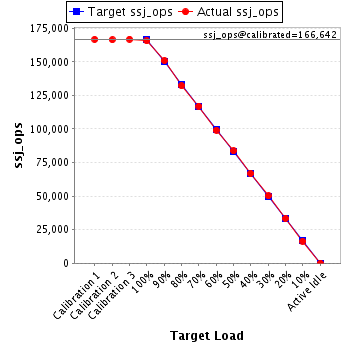
| Target Load | Actual Load | ssj_ops | |
|---|---|---|---|
| Target | Actual | ||
| Calibration 1 | 166,748 | ||
| Calibration 2 | 166,397 | ||
| Calibration 3 | 166,887 | ||
| ssj_ops@calibrated=166,642 | |||
| 100% | 99.4% | 166,642 | 165,633 |
| 90% | 90.5% | 149,978 | 150,861 |
| 80% | 79.3% | 133,313 | 132,145 |
| 70% | 70.3% | 116,649 | 117,066 |
| 60% | 59.5% | 99,985 | 99,115 |
| 50% | 50.2% | 83,321 | 83,622 |
| 40% | 40.1% | 66,657 | 66,820 |
| 30% | 30.1% | 49,993 | 50,122 |
| 20% | 20.1% | 33,328 | 33,445 |
| 10% | 9.9% | 16,664 | 16,492 |
| Active Idle | 0 | 0 | |
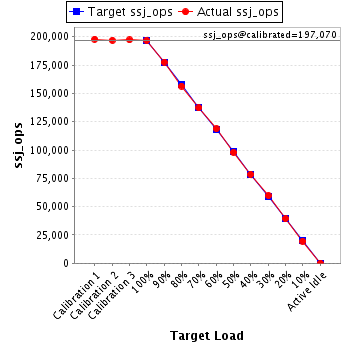
| Target Load | Actual Load | ssj_ops | |
|---|---|---|---|
| Target | Actual | ||
| Calibration 1 | 197,910 | ||
| Calibration 2 | 196,926 | ||
| Calibration 3 | 197,214 | ||
| ssj_ops@calibrated=197,070 | |||
| 100% | 99.8% | 197,070 | 196,756 |
| 90% | 90.2% | 177,363 | 177,709 |
| 80% | 79.4% | 157,656 | 156,514 |
| 70% | 69.6% | 137,949 | 137,211 |
| 60% | 60.3% | 118,242 | 118,807 |
| 50% | 49.8% | 98,535 | 98,075 |
| 40% | 39.9% | 78,828 | 78,546 |
| 30% | 30.3% | 59,121 | 59,755 |
| 20% | 20.0% | 39,414 | 39,356 |
| 10% | 9.9% | 19,707 | 19,508 |
| Active Idle | 0 | 0 | |
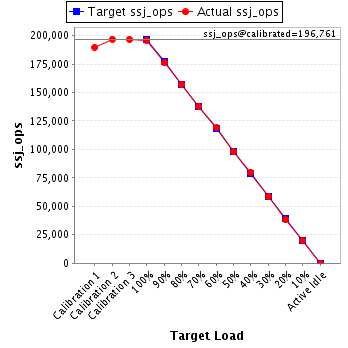
| Target Load | Actual Load | ssj_ops | |
|---|---|---|---|
| Target | Actual | ||
| Calibration 1 | 189,633 | ||
| Calibration 2 | 196,840 | ||
| Calibration 3 | 196,682 | ||
| ssj_ops@calibrated=196,761 | |||
| 100% | 99.7% | 196,761 | 196,074 |
| 90% | 89.5% | 177,085 | 176,149 |
| 80% | 79.7% | 157,409 | 156,738 |
| 70% | 69.8% | 137,733 | 137,423 |
| 60% | 60.4% | 118,057 | 118,823 |
| 50% | 49.8% | 98,380 | 98,036 |
| 40% | 40.6% | 78,704 | 79,905 |
| 30% | 29.7% | 59,028 | 58,448 |
| 20% | 19.4% | 39,352 | 38,208 |
| 10% | 10.1% | 19,676 | 19,900 |
| Active Idle | 0 | 0 | |
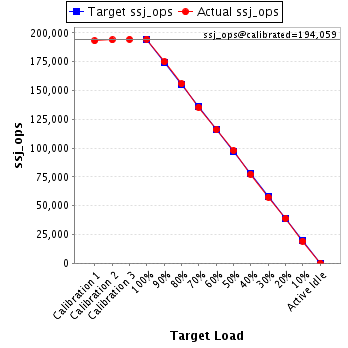
| Target Load | Actual Load | ssj_ops | |
|---|---|---|---|
| Target | Actual | ||
| Calibration 1 | 193,069 | ||
| Calibration 2 | 193,812 | ||
| Calibration 3 | 194,307 | ||
| ssj_ops@calibrated=194,059 | |||
| 100% | 100.2% | 194,059 | 194,525 |
| 90% | 90.1% | 174,653 | 174,880 |
| 80% | 80.2% | 155,248 | 155,721 |
| 70% | 69.8% | 135,842 | 135,374 |
| 60% | 59.8% | 116,436 | 116,007 |
| 50% | 50.4% | 97,030 | 97,761 |
| 40% | 39.8% | 77,624 | 77,241 |
| 30% | 29.6% | 58,218 | 57,456 |
| 20% | 20.1% | 38,812 | 38,923 |
| 10% | 9.9% | 19,406 | 19,221 |
| Active Idle | 0 | 0 | |
| Target Load | Actual Load | ssj_ops | |
|---|---|---|---|
| Target | Actual | ||
| Calibration 1 | 190,010 | ||
| Calibration 2 | 189,177 | ||
| Calibration 3 | 189,129 | ||
| ssj_ops@calibrated=189,153 | |||
| 100% | 99.9% | 189,153 | 189,018 |
| 90% | 89.8% | 170,238 | 169,925 |
| 80% | 80.6% | 151,322 | 152,545 |
| 70% | 70.1% | 132,407 | 132,690 |
| 60% | 60.0% | 113,492 | 113,432 |
| 50% | 49.9% | 94,576 | 94,421 |
| 40% | 39.6% | 75,661 | 74,950 |
| 30% | 30.5% | 56,746 | 57,769 |
| 20% | 19.9% | 37,831 | 37,700 |
| 10% | 10.1% | 18,915 | 19,177 |
| Active Idle | 0 | 0 | |

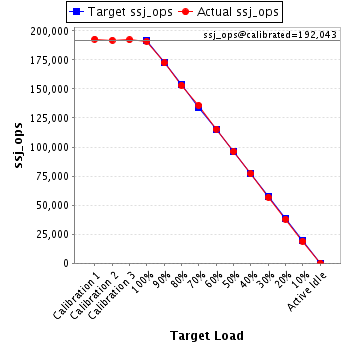
| Target Load | Actual Load | ssj_ops | |
|---|---|---|---|
| Target | Actual | ||
| Calibration 1 | 192,816 | ||
| Calibration 2 | 191,898 | ||
| Calibration 3 | 192,188 | ||
| ssj_ops@calibrated=192,043 | |||
| 100% | 99.5% | 192,043 | 191,052 |
| 90% | 89.8% | 172,838 | 172,398 |
| 80% | 79.7% | 153,634 | 153,077 |
| 70% | 70.7% | 134,430 | 135,821 |
| 60% | 60.1% | 115,226 | 115,501 |
| 50% | 50.0% | 96,021 | 96,097 |
| 40% | 40.0% | 76,817 | 76,910 |
| 30% | 29.6% | 57,613 | 56,850 |
| 20% | 19.8% | 38,409 | 38,021 |
| 10% | 9.9% | 19,204 | 18,966 |
| Active Idle | 0 | 0 | |
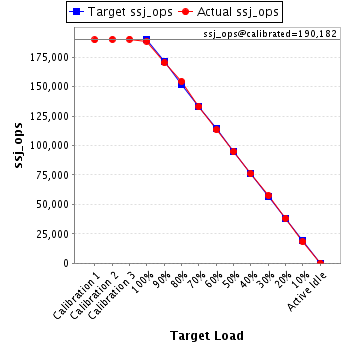
| Target Load | Actual Load | ssj_ops | |
|---|---|---|---|
| Target | Actual | ||
| Calibration 1 | 189,727 | ||
| Calibration 2 | 190,026 | ||
| Calibration 3 | 190,338 | ||
| ssj_ops@calibrated=190,182 | |||
| 100% | 99.2% | 190,182 | 188,591 |
| 90% | 89.6% | 171,164 | 170,344 |
| 80% | 81.2% | 152,146 | 154,344 |
| 70% | 70.0% | 133,127 | 133,043 |
| 60% | 59.7% | 114,109 | 113,445 |
| 50% | 49.8% | 95,091 | 94,719 |
| 40% | 39.9% | 76,073 | 75,920 |
| 30% | 30.2% | 57,055 | 57,421 |
| 20% | 20.1% | 38,036 | 38,249 |
| 10% | 9.6% | 19,018 | 18,308 |
| Active Idle | 0 | 0 | |
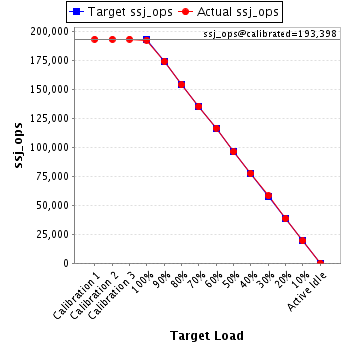
| Target Load | Actual Load | ssj_ops | |
|---|---|---|---|
| Target | Actual | ||
| Calibration 1 | 193,417 | ||
| Calibration 2 | 193,285 | ||
| Calibration 3 | 193,510 | ||
| ssj_ops@calibrated=193,398 | |||
| 100% | 99.6% | 193,398 | 192,650 |
| 90% | 90.1% | 174,058 | 174,340 |
| 80% | 79.6% | 154,718 | 154,018 |
| 70% | 70.0% | 135,378 | 135,473 |
| 60% | 60.4% | 116,039 | 116,774 |
| 50% | 49.7% | 96,699 | 96,204 |
| 40% | 40.1% | 77,359 | 77,508 |
| 30% | 30.1% | 58,019 | 58,193 |
| 20% | 20.0% | 38,680 | 38,683 |
| 10% | 10.0% | 19,340 | 19,359 |
| Active Idle | 0 | 0 | |
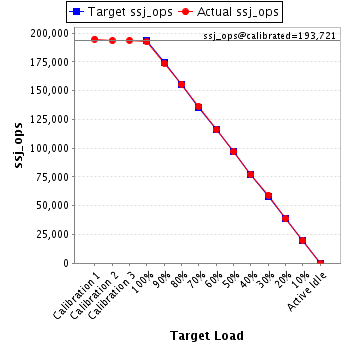
| Target Load | Actual Load | ssj_ops | |
|---|---|---|---|
| Target | Actual | ||
| Calibration 1 | 194,820 | ||
| Calibration 2 | 193,551 | ||
| Calibration 3 | 193,890 | ||
| ssj_ops@calibrated=193,721 | |||
| 100% | 99.3% | 193,721 | 192,414 |
| 90% | 89.8% | 174,348 | 173,946 |
| 80% | 80.3% | 154,976 | 155,612 |
| 70% | 70.4% | 135,604 | 136,381 |
| 60% | 60.0% | 116,232 | 116,223 |
| 50% | 50.0% | 96,860 | 96,937 |
| 40% | 39.9% | 77,488 | 77,254 |
| 30% | 30.5% | 58,116 | 59,140 |
| 20% | 19.9% | 38,744 | 38,629 |
| 10% | 10.2% | 19,372 | 19,767 |
| Active Idle | 0 | 0 | |
| Target Load | Actual Load | ssj_ops | |
|---|---|---|---|
| Target | Actual | ||
| Calibration 1 | 189,685 | ||
| Calibration 2 | 188,832 | ||
| Calibration 3 | 189,218 | ||
| ssj_ops@calibrated=189,025 | |||
| 100% | 100.0% | 189,025 | 188,935 |
| 90% | 89.5% | 170,122 | 169,181 |
| 80% | 79.4% | 151,220 | 150,098 |
| 70% | 70.0% | 132,317 | 132,372 |
| 60% | 60.0% | 113,415 | 113,415 |
| 50% | 49.4% | 94,512 | 93,426 |
| 40% | 39.7% | 75,610 | 75,034 |
| 30% | 29.7% | 56,707 | 56,217 |
| 20% | 20.1% | 37,805 | 38,069 |
| 10% | 10.2% | 18,902 | 19,217 |
| Active Idle | 0 | 0 | |
| Target Load | Actual Load | ssj_ops | |
|---|---|---|---|
| Target | Actual | ||
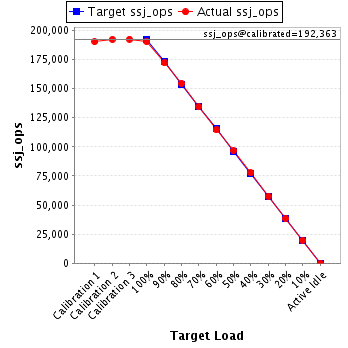
| Calibration 1 | 190,324 | ||
| Calibration 2 | 192,235 | ||
| Calibration 3 | 192,491 | ||
| ssj_ops@calibrated=192,363 | |||
| 100% | 99.0% | 192,363 | 190,412 |
| 90% | 89.5% | 173,127 | 172,207 |
| 80% | 80.4% | 153,890 | 154,623 |
| 70% | 69.9% | 134,654 | 134,376 |
| 60% | 59.5% | 115,418 | 114,535 |
| 50% | 50.3% | 96,181 | 96,740 |
| 40% | 40.3% | 76,945 | 77,567 |
| 30% | 30.0% | 57,709 | 57,744 |
| 20% | 20.0% | 38,473 | 38,455 |
| 10% | 10.3% | 19,236 | 19,775 |
| Active Idle | 0 | 0 | |
| Target Load | Actual Load | ssj_ops | |
|---|---|---|---|
| Target | Actual | ||
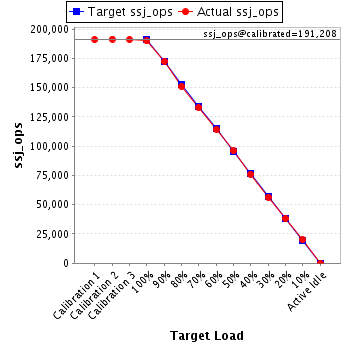
| Calibration 1 | 190,958 | ||
| Calibration 2 | 191,406 | ||
| Calibration 3 | 191,009 | ||
| ssj_ops@calibrated=191,208 | |||
| 100% | 99.3% | 191,208 | 189,893 |
| 90% | 90.1% | 172,087 | 172,341 |
| 80% | 79.1% | 152,966 | 151,336 |
| 70% | 69.6% | 133,845 | 133,085 |
| 60% | 59.8% | 114,725 | 114,356 |
| 50% | 50.2% | 95,604 | 95,915 |
| 40% | 39.8% | 76,483 | 76,115 |
| 30% | 29.5% | 57,362 | 56,410 |
| 20% | 20.0% | 38,242 | 38,233 |
| 10% | 10.4% | 19,121 | 19,949 |
| Active Idle | 0 | 0 | |
| Target Load | Actual Load | ssj_ops | |
|---|---|---|---|
| Target | Actual | ||
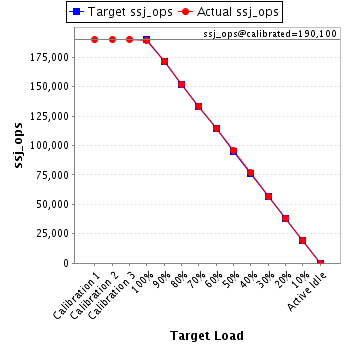
| Calibration 1 | 189,755 | ||
| Calibration 2 | 189,975 | ||
| Calibration 3 | 190,225 | ||
| ssj_ops@calibrated=190,100 | |||
| 100% | 99.7% | 190,100 | 189,436 |
| 90% | 90.3% | 171,090 | 171,567 |
| 80% | 80.0% | 152,080 | 152,055 |
| 70% | 70.2% | 133,070 | 133,364 |
| 60% | 60.2% | 114,060 | 114,471 |
| 50% | 50.3% | 95,050 | 95,703 |
| 40% | 40.4% | 76,040 | 76,762 |
| 30% | 29.7% | 57,030 | 56,552 |
| 20% | 20.0% | 38,020 | 37,975 |
| 10% | 10.2% | 19,010 | 19,304 |
| Active Idle | 0 | 0 | |
| Target Load | Actual Load | ssj_ops | |
|---|---|---|---|
| Target | Actual | ||
| Calibration 1 | 195,251 | ||
| Calibration 2 | 193,968 | ||
| Calibration 3 | 194,279 | ||
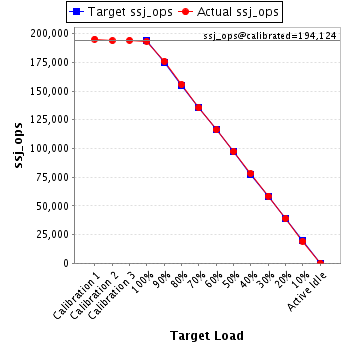
| ssj_ops@calibrated=194,124 | |||
| 100% | 99.7% | 194,124 | 193,463 |
| 90% | 90.7% | 174,711 | 175,997 |
| 80% | 80.3% | 155,299 | 155,875 |
| 70% | 69.8% | 135,886 | 135,464 |
| 60% | 59.9% | 116,474 | 116,280 |
| 50% | 50.2% | 97,062 | 97,450 |
| 40% | 40.3% | 77,649 | 78,252 |
| 30% | 30.2% | 58,237 | 58,560 |
| 20% | 20.1% | 38,825 | 39,044 |
| 10% | 9.9% | 19,412 | 19,217 |
| Active Idle | 0 | 0 | |
| Target Load | Actual Load | ssj_ops | |
|---|---|---|---|
| Target | Actual | ||
| Calibration 1 | 192,671 | ||
| Calibration 2 | 192,679 | ||
| Calibration 3 | 192,304 | ||
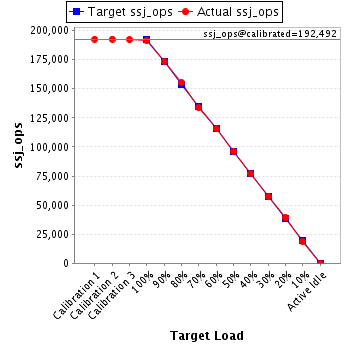
| ssj_ops@calibrated=192,492 | |||
| 100% | 99.7% | 192,492 | 191,905 |
| 90% | 90.1% | 173,242 | 173,402 |
| 80% | 80.7% | 153,993 | 155,268 |
| 70% | 69.6% | 134,744 | 134,029 |
| 60% | 60.3% | 115,495 | 116,065 |
| 50% | 50.1% | 96,246 | 96,478 |
| 40% | 39.9% | 76,997 | 76,788 |
| 30% | 29.9% | 57,747 | 57,613 |
| 20% | 20.3% | 38,498 | 39,029 |
| 10% | 9.8% | 19,249 | 18,772 |
| Active Idle | 0 | 0 | |
| Target Load | Actual Load | ssj_ops | |
|---|---|---|---|
| Target | Actual | ||
| Calibration 1 | 194,408 | ||
| Calibration 2 | 195,569 | ||
| Calibration 3 | 195,556 | ||
| ssj_ops@calibrated=195,563 | |||
| 100% | 99.7% | 195,563 | 195,061 |
| 90% | 90.0% | 176,006 | 176,015 |
| 80% | 80.8% | 156,450 | 158,006 |
| 70% | 69.8% | 136,894 | 136,535 |
| 60% | 59.9% | 117,338 | 117,188 |
| 50% | 49.4% | 97,781 | 96,699 |
| 40% | 40.3% | 78,225 | 78,754 |
| 30% | 30.0% | 58,669 | 58,672 |
| 20% | 20.3% | 39,113 | 39,775 |
| 10% | 10.3% | 19,556 | 20,171 |
| Active Idle | 0 | 0 | |

| Target Load | Actual Load | ssj_ops | |
|---|---|---|---|
| Target | Actual | ||
| Calibration 1 | 189,668 | ||
| Calibration 2 | 191,257 | ||
| Calibration 3 | 190,985 | ||
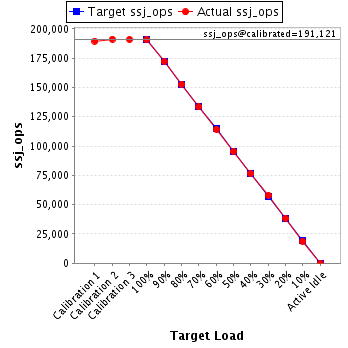
| ssj_ops@calibrated=191,121 | |||
| 100% | 99.7% | 191,121 | 190,619 |
| 90% | 90.0% | 172,009 | 172,104 |
| 80% | 80.0% | 152,897 | 152,855 |
| 70% | 69.8% | 133,785 | 133,385 |
| 60% | 59.9% | 114,673 | 114,386 |
| 50% | 50.0% | 95,561 | 95,514 |
| 40% | 40.0% | 76,448 | 76,536 |
| 30% | 30.3% | 57,336 | 57,904 |
| 20% | 20.1% | 38,224 | 38,410 |
| 10% | 9.9% | 19,112 | 18,858 |
| Active Idle | 0 | 0 | |
| Target Load | Actual Load | ssj_ops | |
|---|---|---|---|
| Target | Actual | ||
| Calibration 1 | 193,237 | ||
| Calibration 2 | 192,129 | ||
| Calibration 3 | 192,441 | ||
| ssj_ops@calibrated=192,285 | |||
| 100% | 99.8% | 192,285 | 191,890 |
| 90% | 89.8% | 173,057 | 172,585 |
| 80% | 80.5% | 153,828 | 154,704 |
| 70% | 70.0% | 134,600 | 134,585 |
| 60% | 59.5% | 115,371 | 114,350 |
| 50% | 50.0% | 96,143 | 96,171 |
| 40% | 40.1% | 76,914 | 77,135 |
| 30% | 29.9% | 57,686 | 57,529 |
| 20% | 19.9% | 38,457 | 38,237 |
| 10% | 9.9% | 19,229 | 19,054 |
| Active Idle | 0 | 0 | |

| Target Load | Actual Load | ssj_ops | |
|---|---|---|---|
| Target | Actual | ||
| Calibration 1 | 195,149 | ||
| Calibration 2 | 194,105 | ||
| Calibration 3 | 193,887 | ||
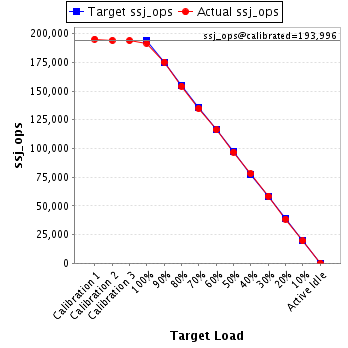
| ssj_ops@calibrated=193,996 | |||
| 100% | 98.7% | 193,996 | 191,471 |
| 90% | 90.3% | 174,597 | 175,234 |
| 80% | 79.5% | 155,197 | 154,307 |
| 70% | 69.5% | 135,797 | 134,920 |
| 60% | 59.9% | 116,398 | 116,274 |
| 50% | 49.9% | 96,998 | 96,876 |
| 40% | 40.2% | 77,598 | 78,018 |
| 30% | 30.1% | 58,199 | 58,413 |
| 20% | 19.9% | 38,799 | 38,529 |
| 10% | 10.0% | 19,400 | 19,473 |
| Active Idle | 0 | 0 | |