SPECpower_ssj2008
Host 'node2' Performance Report
Copyright © 2007-2020 Standard Performance Evaluation Corporation
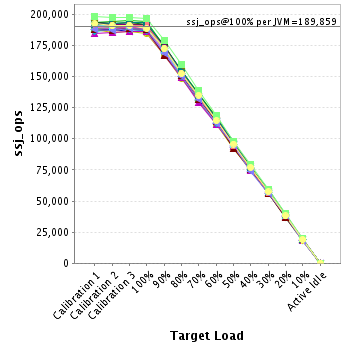
| ASUSTeK Computer Inc. RS620SA-E10-RS12 | ssj_ops@100% = 6,075,488 ssj_ops@100% per JVM = 189,859 |
||||
| Test Sponsor: | ASUSTeK Computer Inc. | SPEC License #: | 9016 | Test Method: | Multi Node |
| Tested By: | ASUSTeK Computer Inc. | Test Location: | Taipei, Taiwan. | Test Date: | Sep 18, 2020 |
| Hardware Availability: | Sep-2020 | Software Availability: | Jul-2020 | Publication: | Oct 7, 2020 |
| System Source: | Single Supplier | System Designation: | Server | Power Provisioning: | Line-powered |
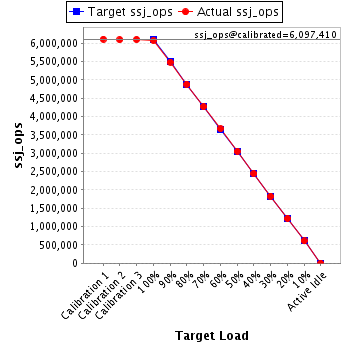
| Target Load | Actual Load | ssj_ops | |
|---|---|---|---|
| Target | Actual | ||
| Calibration 1 | 6,109,158 | ||
| Calibration 2 | 6,093,387 | ||
| Calibration 3 | 6,101,434 | ||
| ssj_ops@calibrated=6,097,410 | |||
| 100% | 99.6% | 6,097,410 | 6,075,488 |
| 90% | 89.9% | 5,487,669 | 5,484,340 |
| 80% | 80.0% | 4,877,928 | 4,878,645 |
| 70% | 70.0% | 4,268,187 | 4,268,213 |
| 60% | 60.1% | 3,658,446 | 3,666,352 |
| 50% | 50.1% | 3,048,705 | 3,052,134 |
| 40% | 40.0% | 2,438,964 | 2,439,366 |
| 30% | 30.0% | 1,829,223 | 1,830,412 |
| 20% | 20.0% | 1,219,482 | 1,220,742 |
| 10% | 10.0% | 609,741 | 607,956 |
| Active Idle | 0 | 0 | |
| Set Identifier: | RS620SA-E10-RS12 |
| Set Description: | System Under Test |
| # of Identical Nodes: | 6 |
| Comment: | 'SUT' |
| Hardware | |
|---|---|
| Hardware Vendor: | ASUSTeK Computer Inc. |
| Model: | RS620SA-E10-RS12 |
| Form Factor: | 1U |
| CPU Name: | AMD EPYC 7742 2.25Ghz |
| CPU Characteristics: | 64-Core, 2.25GHz, 256MB L3 Cache |
| CPU Frequency (MHz): | 2250 |
| CPU(s) Enabled: | 64 cores, 1 chip, 64 cores/chip |
| Hardware Threads: | 128 (2 / core) |
| CPU(s) Orderable: | 1 chip |
| Primary Cache: | 32 KB I + 32 KB D on chip per core |
| Secondary Cache: | 512 KB I+D on chip per core |
| Tertiary Cache: | 256 MB I+D on chip per chip, 16 MB shared / 4 cores |
| Other Cache: | None |
| Memory Amount (GB): | 128 |
| # and size of DIMM: | 8 x 16 GB |
| Memory Details: | 8 x 16GB 2Rx8 PC4-3200AA-R ECC RDIMM; all slots populated |
| Power Supply Quantity and Rating (W): | None |
| Power Supply Details: | Shared |
| Disk Drive: | 1 x 240GB Seagate Nytro 510DCT M.2 PCIE SSD P/N: 03B03-00130200 |
| Disk Controller: | Integrated PCIE controller |
| # and type of Network Interface Cards (NICs) Installed: | 1 x Intel I210 Gigabit Ethernet controller |
| NICs Enabled in Firmware / OS / Connected: | 1/1/1 |
| Network Speed (Mbit): | 1000 |
| Keyboard: | None |
| Mouse: | None |
| Monitor: | None |
| Optical Drives: | No |
| Other Hardware: | None |
| Software | |
|---|---|
| Power Management: | Enabled(See SUT Notes) |
| Operating System (OS): | Suse Linux Enterprise Server 15 SP1 |
| OS Version: | 4.12.14-195-default |
| Filesystem: | xfs |
| JVM Vendor: | Oracle |
| JVM Version: | Java HotSpot(TM) 64-Bit Server VM (build 14.0.2+12-46, mixed mode, sharing), version 14.0.2 |
| JVM Command-line Options: | -server -Xmn1200m -Xms1400m -Xmx1400m -XX:MaxTenuringThreshold=1 -XX:ParallelGCThreads=2 -XX:InlineSmallCode=4000 -XX:MaxInlineSize=300 -XX:FreqInlineSize=3000 -XX:+UseParallelGC -XX:+UseLargePages -XX:+UseHugeTLBFS -XX:+UseTransparentHugePages |
| JVM Affinity: | for each two physicalCores { numactl -C physicalCoreId, physicalCoreId + 1, physicalCoreId + 64, physicalCoreId + 65 -l } |
| JVM Instances: | 32 |
| JVM Initial Heap (MB): | 1400 |
| JVM Maximum Heap (MB): | 1400 |
| JVM Address Bits: | 64 |
| Boot Firmware Version: | 0305 |
| Management Firmware Version: | 2.1.09 |
| Workload Version: | SSJ 1.2.10 |
| Director Location: | Controller |
| Other Software: | None |
| JVM Instance | ssj_ops@100% |
|---|---|
| node2.001 | 190,785 |
| node2.002 | 189,245 |
| node2.003 | 191,009 |
| node2.004 | 189,915 |
| node2.005 | 188,822 |
| node2.006 | 189,660 |
| node2.007 | 191,617 |
| node2.008 | 188,670 |
| node2.009 | 188,971 |
| node2.010 | 186,904 |
| node2.011 | 194,025 |
| node2.012 | 184,876 |
| node2.013 | 186,458 |
| node2.014 | 186,580 |
| node2.015 | 187,824 |
| node2.016 | 191,596 |
| node2.017 | 190,202 |
| node2.018 | 188,991 |
| node2.019 | 189,587 |
| node2.020 | 188,557 |
| node2.021 | 189,731 |
| node2.022 | 190,164 |
| node2.023 | 187,691 |
| node2.024 | 192,137 |
| node2.025 | 191,938 |
| node2.026 | 190,563 |
| node2.027 | 191,346 |
| node2.028 | 193,343 |
| node2.029 | 191,308 |
| node2.030 | 187,560 |
| node2.031 | 196,898 |
| node2.032 | 188,515 |
| ssj_ops@100% | 6,075,488 |
| ssj_ops@100% per JVM | 189,859 |
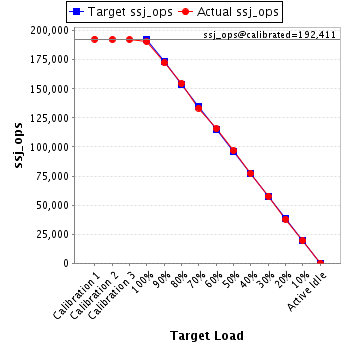
| Target Load | Actual Load | ssj_ops | |
|---|---|---|---|
| Target | Actual | ||
| Calibration 1 | 192,744 | ||
| Calibration 2 | 192,310 | ||
| Calibration 3 | 192,512 | ||
| ssj_ops@calibrated=192,411 | |||
| 100% | 99.2% | 192,411 | 190,785 |
| 90% | 89.7% | 173,170 | 172,511 |
| 80% | 80.4% | 153,929 | 154,624 |
| 70% | 69.4% | 134,688 | 133,531 |
| 60% | 60.2% | 115,447 | 115,787 |
| 50% | 50.3% | 96,206 | 96,768 |
| 40% | 40.1% | 76,965 | 77,181 |
| 30% | 30.0% | 57,723 | 57,721 |
| 20% | 19.7% | 38,482 | 37,940 |
| 10% | 10.0% | 19,241 | 19,317 |
| Active Idle | 0 | 0 | |
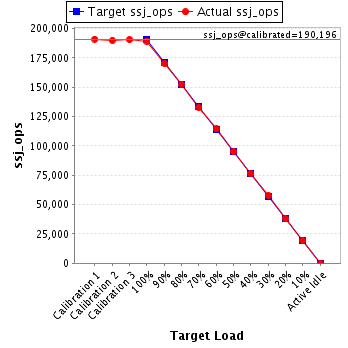
| Target Load | Actual Load | ssj_ops | |
|---|---|---|---|
| Target | Actual | ||
| Calibration 1 | 190,895 | ||
| Calibration 2 | 189,888 | ||
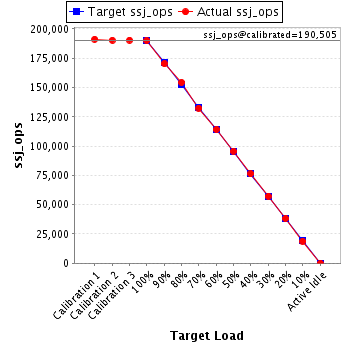
| Calibration 3 | 190,505 | ||
| ssj_ops@calibrated=190,196 | |||
| 100% | 99.5% | 190,196 | 189,245 |
| 90% | 89.5% | 171,177 | 170,216 |
| 80% | 80.2% | 152,157 | 152,476 |
| 70% | 69.9% | 133,137 | 133,041 |
| 60% | 60.2% | 114,118 | 114,454 |
| 50% | 50.0% | 95,098 | 95,167 |
| 40% | 40.1% | 76,079 | 76,357 |
| 30% | 30.3% | 57,059 | 57,702 |
| 20% | 19.9% | 38,039 | 37,823 |
| 10% | 10.1% | 19,020 | 19,183 |
| Active Idle | 0 | 0 | |
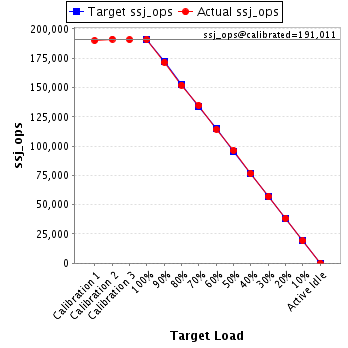
| Target Load | Actual Load | ssj_ops | |
|---|---|---|---|
| Target | Actual | ||
| Calibration 1 | 190,142 | ||
| Calibration 2 | 191,282 | ||
| Calibration 3 | 190,740 | ||
| ssj_ops@calibrated=191,011 | |||
| 100% | 100.0% | 191,011 | 191,009 |
| 90% | 89.8% | 171,910 | 171,552 |
| 80% | 79.6% | 152,809 | 152,087 |
| 70% | 70.5% | 133,708 | 134,739 |
| 60% | 59.9% | 114,607 | 114,376 |
| 50% | 50.4% | 95,505 | 96,275 |
| 40% | 40.1% | 76,404 | 76,512 |
| 30% | 29.8% | 57,303 | 56,986 |
| 20% | 20.1% | 38,202 | 38,401 |
| 10% | 10.1% | 19,101 | 19,212 |
| Active Idle | 0 | 0 | |
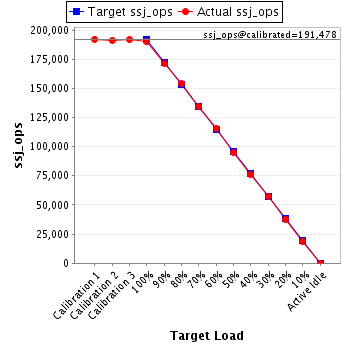
| Target Load | Actual Load | ssj_ops | |
|---|---|---|---|
| Target | Actual | ||
| Calibration 1 | 192,188 | ||
| Calibration 2 | 191,182 | ||
| Calibration 3 | 191,775 | ||
| ssj_ops@calibrated=191,478 | |||
| 100% | 99.2% | 191,478 | 189,915 |
| 90% | 89.6% | 172,330 | 171,535 |
| 80% | 80.3% | 153,182 | 153,814 |
| 70% | 70.1% | 134,035 | 134,264 |
| 60% | 60.5% | 114,887 | 115,911 |
| 50% | 49.6% | 95,739 | 94,994 |
| 40% | 39.9% | 76,591 | 76,350 |
| 30% | 30.1% | 57,443 | 57,554 |
| 20% | 19.8% | 38,296 | 37,958 |
| 10% | 9.9% | 19,148 | 18,937 |
| Active Idle | 0 | 0 | |
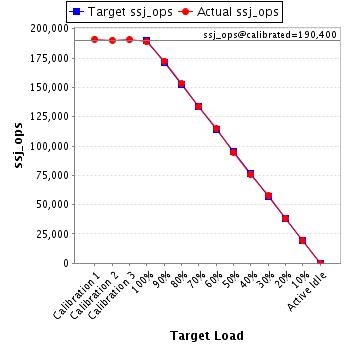
| Target Load | Actual Load | ssj_ops | |
|---|---|---|---|
| Target | Actual | ||
| Calibration 1 | 191,114 | ||
| Calibration 2 | 190,148 | ||
| Calibration 3 | 190,652 | ||
| ssj_ops@calibrated=190,400 | |||
| 100% | 99.2% | 190,400 | 188,822 |
| 90% | 90.5% | 171,360 | 172,349 |
| 80% | 80.3% | 152,320 | 152,967 |
| 70% | 70.2% | 133,280 | 133,654 |
| 60% | 60.4% | 114,240 | 114,955 |
| 50% | 49.8% | 95,200 | 94,877 |
| 40% | 40.0% | 76,160 | 76,111 |
| 30% | 30.2% | 57,120 | 57,548 |
| 20% | 20.1% | 38,080 | 38,309 |
| 10% | 10.1% | 19,040 | 19,234 |
| Active Idle | 0 | 0 | |
| Target Load | Actual Load | ssj_ops | |
|---|---|---|---|
| Target | Actual | ||
| Calibration 1 | 190,214 | ||
| Calibration 2 | 190,224 | ||
| Calibration 3 | 189,196 | ||
| ssj_ops@calibrated=189,710 | |||
| 100% | 100.0% | 189,710 | 189,660 |
| 90% | 89.8% | 170,739 | 170,435 |
| 80% | 80.1% | 151,768 | 152,044 |
| 70% | 69.5% | 132,797 | 131,859 |
| 60% | 59.9% | 113,826 | 113,586 |
| 50% | 50.4% | 94,855 | 95,564 |
| 40% | 40.0% | 75,884 | 75,807 |
| 30% | 30.1% | 56,913 | 57,142 |
| 20% | 19.8% | 37,942 | 37,613 |
| 10% | 9.7% | 18,971 | 18,479 |
| Active Idle | 0 | 0 | |
| Target Load | Actual Load | ssj_ops | |
|---|---|---|---|
| Target | Actual | ||
| Calibration 1 | 193,652 | ||
| Calibration 2 | 192,615 | ||
| Calibration 3 | 192,697 | ||
| ssj_ops@calibrated=192,656 | |||
| 100% | 99.5% | 192,656 | 191,617 |
| 90% | 90.1% | 173,390 | 173,515 |
| 80% | 80.2% | 154,125 | 154,455 |
| 70% | 70.0% | 134,859 | 134,871 |
| 60% | 61.0% | 115,593 | 117,481 |
| 50% | 49.7% | 96,328 | 95,702 |
| 40% | 39.7% | 77,062 | 76,446 |
| 30% | 30.2% | 57,797 | 58,184 |
| 20% | 20.0% | 38,531 | 38,517 |
| 10% | 10.1% | 19,266 | 19,446 |
| Active Idle | 0 | 0 | |
| Target Load | Actual Load | ssj_ops | |
|---|---|---|---|
| Target | Actual | ||
| Calibration 1 | 189,952 | ||
| Calibration 2 | 189,016 | ||
| Calibration 3 | 189,296 | ||
| ssj_ops@calibrated=189,156 | |||
| 100% | 99.7% | 189,156 | 188,670 |
| 90% | 89.9% | 170,240 | 170,006 |
| 80% | 80.6% | 151,325 | 152,458 |
| 70% | 70.2% | 132,409 | 132,721 |
| 60% | 60.6% | 113,494 | 114,573 |
| 50% | 50.3% | 94,578 | 95,062 |
| 40% | 40.1% | 75,662 | 75,842 |
| 30% | 30.1% | 56,747 | 56,908 |
| 20% | 19.9% | 37,831 | 37,605 |
| 10% | 10.2% | 18,916 | 19,287 |
| Active Idle | 0 | 0 | |
| Target Load | Actual Load | ssj_ops | |
|---|---|---|---|
| Target | Actual | ||
| Calibration 1 | 192,426 | ||
| Calibration 2 | 189,709 | ||
| Calibration 3 | 189,716 | ||
| ssj_ops@calibrated=189,713 | |||
| 100% | 99.6% | 189,713 | 188,971 |
| 90% | 91.0% | 170,741 | 172,660 |
| 80% | 80.3% | 151,770 | 152,424 |
| 70% | 70.0% | 132,799 | 132,723 |
| 60% | 60.4% | 113,828 | 114,549 |
| 50% | 50.1% | 94,856 | 94,986 |
| 40% | 40.5% | 75,885 | 76,741 |
| 30% | 29.7% | 56,914 | 56,371 |
| 20% | 20.2% | 37,943 | 38,288 |
| 10% | 10.0% | 18,971 | 18,901 |
| Active Idle | 0 | 0 | |
| Target Load | Actual Load | ssj_ops | |
|---|---|---|---|
| Target | Actual | ||
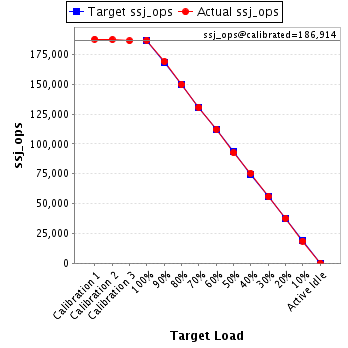
| Calibration 1 | 187,862 | ||
| Calibration 2 | 187,430 | ||
| Calibration 3 | 186,398 | ||
| ssj_ops@calibrated=186,914 | |||
| 100% | 100.0% | 186,914 | 186,904 |
| 90% | 90.5% | 168,223 | 169,097 |
| 80% | 80.2% | 149,531 | 149,824 |
| 70% | 69.9% | 130,840 | 130,692 |
| 60% | 60.1% | 112,148 | 112,360 |
| 50% | 49.5% | 93,457 | 92,603 |
| 40% | 40.4% | 74,766 | 75,455 |
| 30% | 29.9% | 56,074 | 55,850 |
| 20% | 20.2% | 37,383 | 37,749 |
| 10% | 10.0% | 18,691 | 18,629 |
| Active Idle | 0 | 0 | |
| Target Load | Actual Load | ssj_ops | |
|---|---|---|---|
| Target | Actual | ||
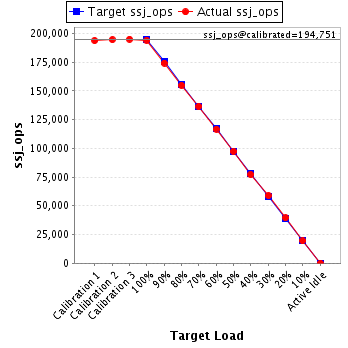
| Calibration 1 | 193,718 | ||
| Calibration 2 | 194,493 | ||
| Calibration 3 | 195,009 | ||
| ssj_ops@calibrated=194,751 | |||
| 100% | 99.6% | 194,751 | 194,025 |
| 90% | 89.5% | 175,276 | 174,260 |
| 80% | 79.5% | 155,801 | 154,851 |
| 70% | 70.1% | 136,326 | 136,523 |
| 60% | 60.0% | 116,851 | 116,805 |
| 50% | 50.1% | 97,375 | 97,524 |
| 40% | 39.6% | 77,900 | 77,119 |
| 30% | 30.2% | 58,425 | 58,868 |
| 20% | 20.3% | 38,950 | 39,437 |
| 10% | 10.0% | 19,475 | 19,454 |
| Active Idle | 0 | 0 | |
| Target Load | Actual Load | ssj_ops | |
|---|---|---|---|
| Target | Actual | ||
| Calibration 1 | 187,339 | ||
| Calibration 2 | 185,492 | ||
| Calibration 3 | 186,030 | ||
| ssj_ops@calibrated=185,761 | |||
| 100% | 99.5% | 185,761 | 184,876 |
| 90% | 89.6% | 167,185 | 166,469 |
| 80% | 80.1% | 148,609 | 148,747 |
| 70% | 70.4% | 130,033 | 130,770 |
| 60% | 60.0% | 111,457 | 111,389 |
| 50% | 49.8% | 92,881 | 92,472 |
| 40% | 39.9% | 74,304 | 74,106 |
| 30% | 30.0% | 55,728 | 55,674 |
| 20% | 20.0% | 37,152 | 37,067 |
| 10% | 9.9% | 18,576 | 18,337 |
| Active Idle | 0 | 0 | |

| Target Load | Actual Load | ssj_ops | |
|---|---|---|---|
| Target | Actual | ||
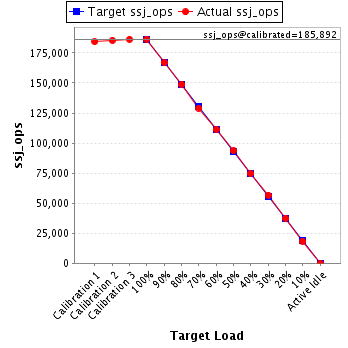
| Calibration 1 | 184,381 | ||
| Calibration 2 | 185,415 | ||
| Calibration 3 | 186,370 | ||
| ssj_ops@calibrated=185,892 | |||
| 100% | 100.3% | 185,892 | 186,458 |
| 90% | 89.8% | 167,303 | 167,010 |
| 80% | 80.1% | 148,714 | 148,958 |
| 70% | 69.5% | 130,125 | 129,172 |
| 60% | 59.9% | 111,535 | 111,389 |
| 50% | 50.3% | 92,946 | 93,558 |
| 40% | 40.2% | 74,357 | 74,810 |
| 30% | 30.5% | 55,768 | 56,720 |
| 20% | 20.1% | 37,178 | 37,439 |
| 10% | 9.9% | 18,589 | 18,387 |
| Active Idle | 0 | 0 | |
| Target Load | Actual Load | ssj_ops | |
|---|---|---|---|
| Target | Actual | ||
| Calibration 1 | 186,193 | ||
| Calibration 2 | 187,900 | ||
| Calibration 3 | 187,667 | ||
| ssj_ops@calibrated=187,783 | |||
| 100% | 99.4% | 187,783 | 186,580 |
| 90% | 89.6% | 169,005 | 168,251 |
| 80% | 80.0% | 150,227 | 150,219 |
| 70% | 69.9% | 131,448 | 131,276 |
| 60% | 59.9% | 112,670 | 112,498 |
| 50% | 50.2% | 93,892 | 94,345 |
| 40% | 40.3% | 75,113 | 75,617 |
| 30% | 30.2% | 56,335 | 56,708 |
| 20% | 19.5% | 37,557 | 36,669 |
| 10% | 9.8% | 18,778 | 18,489 |
| Active Idle | 0 | 0 | |

| Target Load | Actual Load | ssj_ops | |
|---|---|---|---|
| Target | Actual | ||
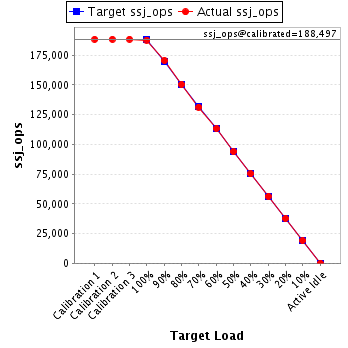
| Calibration 1 | 188,436 | ||
| Calibration 2 | 188,438 | ||
| Calibration 3 | 188,557 | ||
| ssj_ops@calibrated=188,497 | |||
| 100% | 99.6% | 188,497 | 187,824 |
| 90% | 90.5% | 169,648 | 170,555 |
| 80% | 79.9% | 150,798 | 150,535 |
| 70% | 69.7% | 131,948 | 131,454 |
| 60% | 60.1% | 113,098 | 113,374 |
| 50% | 49.8% | 94,249 | 93,940 |
| 40% | 39.9% | 75,399 | 75,253 |
| 30% | 29.9% | 56,549 | 56,312 |
| 20% | 20.1% | 37,699 | 37,800 |
| 10% | 10.2% | 18,850 | 19,144 |
| Active Idle | 0 | 0 | |
| Target Load | Actual Load | ssj_ops | |
|---|---|---|---|
| Target | Actual | ||
| Calibration 1 | 193,434 | ||
| Calibration 2 | 191,874 | ||
| Calibration 3 | 192,054 | ||
| ssj_ops@calibrated=191,964 | |||
| 100% | 99.8% | 191,964 | 191,596 |
| 90% | 89.1% | 172,767 | 171,026 |
| 80% | 79.2% | 153,571 | 152,013 |
| 70% | 69.6% | 134,375 | 133,660 |
| 60% | 59.9% | 115,178 | 114,923 |
| 50% | 50.7% | 95,982 | 97,403 |
| 40% | 40.4% | 76,786 | 77,564 |
| 30% | 29.6% | 57,589 | 56,871 |
| 20% | 20.1% | 38,393 | 38,672 |
| 10% | 9.9% | 19,196 | 18,921 |
| Active Idle | 0 | 0 | |

| Target Load | Actual Load | ssj_ops | |
|---|---|---|---|
| Target | Actual | ||
| Calibration 1 | 191,306 | ||
| Calibration 2 | 190,437 | ||
| Calibration 3 | 190,572 | ||
| ssj_ops@calibrated=190,505 | |||
| 100% | 99.8% | 190,505 | 190,202 |
| 90% | 89.4% | 171,454 | 170,325 |
| 80% | 81.1% | 152,404 | 154,441 |
| 70% | 69.5% | 133,353 | 132,496 |
| 60% | 60.0% | 114,303 | 114,249 |
| 50% | 50.3% | 95,252 | 95,800 |
| 40% | 40.1% | 76,202 | 76,299 |
| 30% | 30.1% | 57,151 | 57,297 |
| 20% | 20.1% | 38,101 | 38,273 |
| 10% | 9.9% | 19,050 | 18,858 |
| Active Idle | 0 | 0 | |
| Target Load | Actual Load | ssj_ops | |
|---|---|---|---|
| Target | Actual | ||
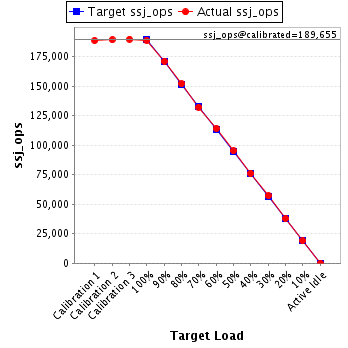
| Calibration 1 | 188,766 | ||
| Calibration 2 | 189,374 | ||
| Calibration 3 | 189,936 | ||
| ssj_ops@calibrated=189,655 | |||
| 100% | 99.7% | 189,655 | 188,991 |
| 90% | 90.3% | 170,690 | 171,249 |
| 80% | 80.2% | 151,724 | 152,095 |
| 70% | 69.8% | 132,759 | 132,345 |
| 60% | 60.2% | 113,793 | 114,182 |
| 50% | 50.2% | 94,828 | 95,198 |
| 40% | 40.1% | 75,862 | 76,142 |
| 30% | 30.1% | 56,897 | 57,084 |
| 20% | 20.0% | 37,931 | 38,016 |
| 10% | 10.0% | 18,966 | 19,004 |
| Active Idle | 0 | 0 | |
| Target Load | Actual Load | ssj_ops | |
|---|---|---|---|
| Target | Actual | ||
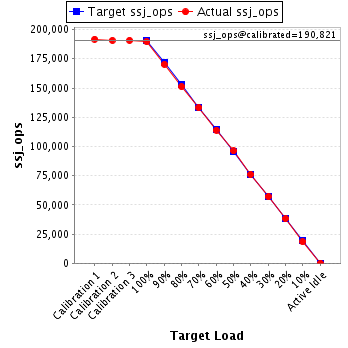
| Calibration 1 | 191,799 | ||
| Calibration 2 | 190,758 | ||
| Calibration 3 | 190,883 | ||
| ssj_ops@calibrated=190,821 | |||
| 100% | 99.4% | 190,821 | 189,587 |
| 90% | 89.3% | 171,739 | 170,345 |
| 80% | 79.2% | 152,657 | 151,051 |
| 70% | 69.8% | 133,574 | 133,209 |
| 60% | 59.7% | 114,492 | 113,976 |
| 50% | 50.4% | 95,410 | 96,090 |
| 40% | 39.8% | 76,328 | 76,003 |
| 30% | 29.9% | 57,246 | 56,983 |
| 20% | 20.0% | 38,164 | 38,150 |
| 10% | 9.6% | 19,082 | 18,369 |
| Active Idle | 0 | 0 | |
| Target Load | Actual Load | ssj_ops | |
|---|---|---|---|
| Target | Actual | ||
| Calibration 1 | 189,680 | ||
| Calibration 2 | 188,900 | ||
| Calibration 3 | 189,236 | ||
| ssj_ops@calibrated=189,068 | |||
| 100% | 99.7% | 189,068 | 188,557 |
| 90% | 89.9% | 170,161 | 170,022 |
| 80% | 79.4% | 151,254 | 150,119 |
| 70% | 70.5% | 132,348 | 133,256 |
| 60% | 59.9% | 113,441 | 113,182 |
| 50% | 49.4% | 94,534 | 93,429 |
| 40% | 40.6% | 75,627 | 76,704 |
| 30% | 30.2% | 56,720 | 57,147 |
| 20% | 19.9% | 37,814 | 37,672 |
| 10% | 9.8% | 18,907 | 18,586 |
| Active Idle | 0 | 0 | |

| Target Load | Actual Load | ssj_ops | |
|---|---|---|---|
| Target | Actual | ||
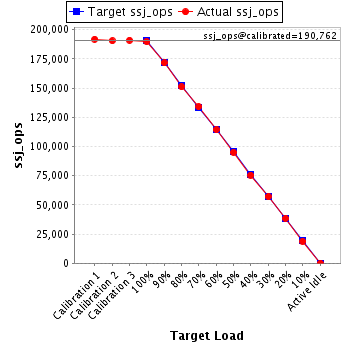
| Calibration 1 | 191,933 | ||
| Calibration 2 | 190,420 | ||
| Calibration 3 | 191,104 | ||
| ssj_ops@calibrated=190,762 | |||
| 100% | 99.5% | 190,762 | 189,731 |
| 90% | 90.0% | 171,686 | 171,625 |
| 80% | 79.2% | 152,610 | 151,101 |
| 70% | 70.3% | 133,534 | 134,125 |
| 60% | 60.0% | 114,457 | 114,472 |
| 50% | 49.8% | 95,381 | 95,078 |
| 40% | 39.6% | 76,305 | 75,540 |
| 30% | 29.9% | 57,229 | 57,061 |
| 20% | 20.2% | 38,152 | 38,573 |
| 10% | 9.9% | 19,076 | 18,833 |
| Active Idle | 0 | 0 | |
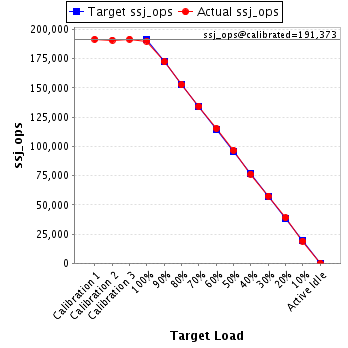
| Target Load | Actual Load | ssj_ops | |
|---|---|---|---|
| Target | Actual | ||
| Calibration 1 | 191,695 | ||
| Calibration 2 | 191,010 | ||
| Calibration 3 | 191,736 | ||
| ssj_ops@calibrated=191,373 | |||
| 100% | 99.4% | 191,373 | 190,164 |
| 90% | 90.1% | 172,236 | 172,442 |
| 80% | 79.8% | 153,099 | 152,769 |
| 70% | 70.2% | 133,961 | 134,330 |
| 60% | 60.3% | 114,824 | 115,396 |
| 50% | 50.5% | 95,687 | 96,641 |
| 40% | 39.9% | 76,549 | 76,358 |
| 30% | 30.1% | 57,412 | 57,546 |
| 20% | 20.4% | 38,275 | 38,948 |
| 10% | 9.9% | 19,137 | 19,012 |
| Active Idle | 0 | 0 | |
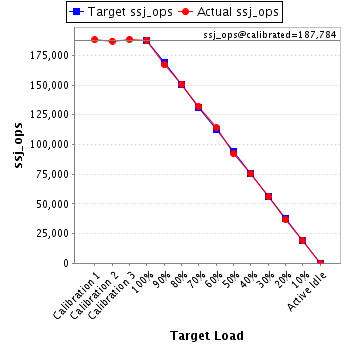
| Target Load | Actual Load | ssj_ops | |
|---|---|---|---|
| Target | Actual | ||
| Calibration 1 | 188,038 | ||
| Calibration 2 | 186,996 | ||
| Calibration 3 | 188,572 | ||
| ssj_ops@calibrated=187,784 | |||
| 100% | 100.0% | 187,784 | 187,691 |
| 90% | 88.9% | 169,005 | 166,994 |
| 80% | 80.3% | 150,227 | 150,828 |
| 70% | 70.1% | 131,449 | 131,639 |
| 60% | 60.7% | 112,670 | 113,987 |
| 50% | 49.1% | 93,892 | 92,221 |
| 40% | 40.1% | 75,114 | 75,343 |
| 30% | 29.8% | 56,335 | 56,022 |
| 20% | 19.7% | 37,557 | 36,996 |
| 10% | 10.3% | 18,778 | 19,274 |
| Active Idle | 0 | 0 | |
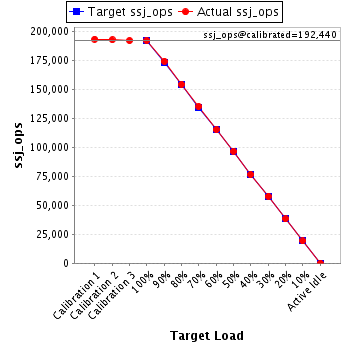
| Target Load | Actual Load | ssj_ops | |
|---|---|---|---|
| Target | Actual | ||
| Calibration 1 | 193,342 | ||
| Calibration 2 | 192,765 | ||
| Calibration 3 | 192,114 | ||
| ssj_ops@calibrated=192,440 | |||
| 100% | 99.8% | 192,440 | 192,137 |
| 90% | 90.5% | 173,196 | 174,254 |
| 80% | 80.2% | 153,952 | 154,321 |
| 70% | 70.3% | 134,708 | 135,375 |
| 60% | 59.9% | 115,464 | 115,297 |
| 50% | 50.3% | 96,220 | 96,702 |
| 40% | 39.7% | 76,976 | 76,478 |
| 30% | 30.0% | 57,732 | 57,762 |
| 20% | 19.9% | 38,488 | 38,235 |
| 10% | 10.0% | 19,244 | 19,212 |
| Active Idle | 0 | 0 | |
| Target Load | Actual Load | ssj_ops | |
|---|---|---|---|
| Target | Actual | ||
| Calibration 1 | 193,139 | ||
| Calibration 2 | 192,686 | ||
| Calibration 3 | 193,544 | ||
| ssj_ops@calibrated=193,115 | |||
| 100% | 99.4% | 193,115 | 191,938 |
| 90% | 90.6% | 173,803 | 175,049 |
| 80% | 79.5% | 154,492 | 153,565 |
| 70% | 70.1% | 135,180 | 135,437 |
| 60% | 60.1% | 115,869 | 116,108 |
| 50% | 50.2% | 96,557 | 96,915 |
| 40% | 40.0% | 77,246 | 77,321 |
| 30% | 29.5% | 57,934 | 56,909 |
| 20% | 20.1% | 38,623 | 38,862 |
| 10% | 10.0% | 19,311 | 19,400 |
| Active Idle | 0 | 0 | |

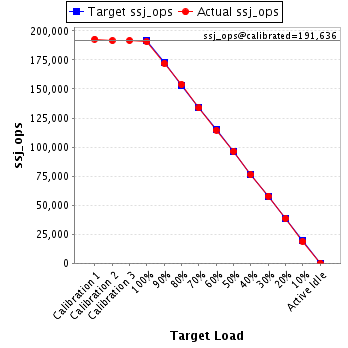
| Target Load | Actual Load | ssj_ops | |
|---|---|---|---|
| Target | Actual | ||
| Calibration 1 | 192,837 | ||
| Calibration 2 | 191,624 | ||
| Calibration 3 | 191,648 | ||
| ssj_ops@calibrated=191,636 | |||
| 100% | 99.4% | 191,636 | 190,563 |
| 90% | 89.7% | 172,472 | 171,893 |
| 80% | 80.3% | 153,309 | 153,887 |
| 70% | 69.7% | 134,145 | 133,647 |
| 60% | 59.8% | 114,982 | 114,574 |
| 50% | 50.3% | 95,818 | 96,393 |
| 40% | 39.7% | 76,654 | 76,105 |
| 30% | 30.1% | 57,491 | 57,775 |
| 20% | 20.1% | 38,327 | 38,465 |
| 10% | 9.8% | 19,164 | 18,687 |
| Active Idle | 0 | 0 | |
| Target Load | Actual Load | ssj_ops | |
|---|---|---|---|
| Target | Actual | ||
| Calibration 1 | 192,914 | ||
| Calibration 2 | 191,962 | ||
| Calibration 3 | 191,832 | ||
| ssj_ops@calibrated=191,897 | |||
| 100% | 99.7% | 191,897 | 191,346 |
| 90% | 90.7% | 172,707 | 174,096 |
| 80% | 79.7% | 153,518 | 152,902 |
| 70% | 69.6% | 134,328 | 133,558 |
| 60% | 60.6% | 115,138 | 116,295 |
| 50% | 50.1% | 95,949 | 96,167 |
| 40% | 39.8% | 76,759 | 76,432 |
| 30% | 30.2% | 57,569 | 57,909 |
| 20% | 20.1% | 38,379 | 38,502 |
| 10% | 10.2% | 19,190 | 19,517 |
| Active Idle | 0 | 0 | |

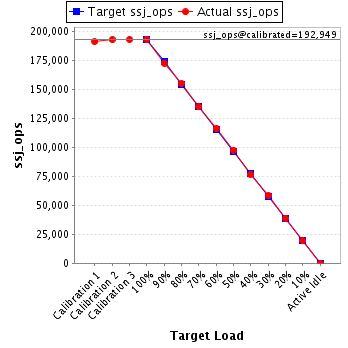
| Target Load | Actual Load | ssj_ops | |
|---|---|---|---|
| Target | Actual | ||
| Calibration 1 | 191,383 | ||
| Calibration 2 | 192,801 | ||
| Calibration 3 | 193,097 | ||
| ssj_ops@calibrated=192,949 | |||
| 100% | 100.2% | 192,949 | 193,343 |
| 90% | 89.5% | 173,654 | 172,675 |
| 80% | 80.3% | 154,359 | 154,991 |
| 70% | 69.9% | 135,064 | 134,947 |
| 60% | 60.3% | 115,769 | 116,310 |
| 50% | 50.6% | 96,474 | 97,549 |
| 40% | 39.9% | 77,180 | 76,892 |
| 30% | 30.2% | 57,885 | 58,302 |
| 20% | 20.2% | 38,590 | 38,975 |
| 10% | 10.0% | 19,295 | 19,342 |
| Active Idle | 0 | 0 | |
| Target Load | Actual Load | ssj_ops | |
|---|---|---|---|
| Target | Actual | ||
| Calibration 1 | 189,400 | ||
| Calibration 2 | 190,756 | ||
| Calibration 3 | 191,243 | ||
| ssj_ops@calibrated=190,999 | |||
| 100% | 100.2% | 190,999 | 191,308 |
| 90% | 90.1% | 171,899 | 172,131 |
| 80% | 79.6% | 152,799 | 152,032 |
| 70% | 70.0% | 133,700 | 133,615 |
| 60% | 59.9% | 114,600 | 114,378 |
| 50% | 49.7% | 95,500 | 94,860 |
| 40% | 39.9% | 76,400 | 76,202 |
| 30% | 29.8% | 57,300 | 56,838 |
| 20% | 19.9% | 38,200 | 38,014 |
| 10% | 10.0% | 19,100 | 19,045 |
| Active Idle | 0 | 0 | |

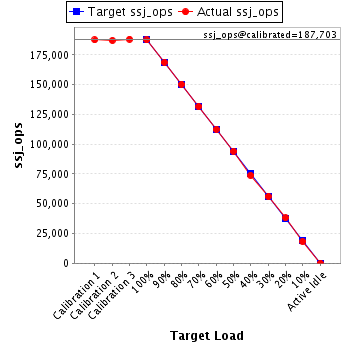
| Target Load | Actual Load | ssj_ops | |
|---|---|---|---|
| Target | Actual | ||
| Calibration 1 | 187,574 | ||
| Calibration 2 | 187,164 | ||
| Calibration 3 | 188,242 | ||
| ssj_ops@calibrated=187,703 | |||
| 100% | 99.9% | 187,703 | 187,560 |
| 90% | 90.0% | 168,933 | 168,850 |
| 80% | 80.1% | 150,162 | 150,333 |
| 70% | 70.1% | 131,392 | 131,628 |
| 60% | 60.0% | 112,622 | 112,531 |
| 50% | 50.2% | 93,851 | 94,246 |
| 40% | 39.4% | 75,081 | 73,868 |
| 30% | 29.9% | 56,311 | 56,079 |
| 20% | 20.3% | 37,541 | 38,070 |
| 10% | 9.7% | 18,770 | 18,258 |
| Active Idle | 0 | 0 | |
| Target Load | Actual Load | ssj_ops | |
|---|---|---|---|
| Target | Actual | ||
| Calibration 1 | 198,300 | ||
| Calibration 2 | 197,586 | ||
| Calibration 3 | 197,633 | ||
| ssj_ops@calibrated=197,610 | |||
| 100% | 99.6% | 197,610 | 196,898 |
| 90% | 90.3% | 177,849 | 178,522 |
| 80% | 80.7% | 158,088 | 159,531 |
| 70% | 70.2% | 138,327 | 138,816 |
| 60% | 59.9% | 118,566 | 118,414 |
| 50% | 49.5% | 98,805 | 97,847 |
| 40% | 40.3% | 79,044 | 79,608 |
| 30% | 30.0% | 59,283 | 59,277 |
| 20% | 20.1% | 39,522 | 39,725 |
| 10% | 10.2% | 19,761 | 20,213 |
| Active Idle | 0 | 0 | |

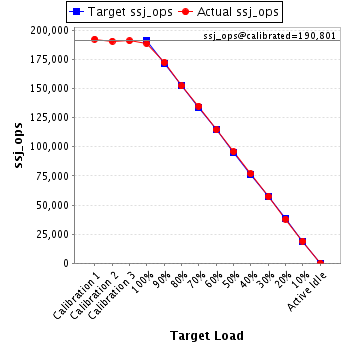
| Target Load | Actual Load | ssj_ops | |
|---|---|---|---|
| Target | Actual | ||
| Calibration 1 | 192,363 | ||
| Calibration 2 | 190,735 | ||
| Calibration 3 | 190,867 | ||
| ssj_ops@calibrated=190,801 | |||
| 100% | 98.8% | 190,801 | 188,515 |
| 90% | 90.4% | 171,721 | 172,420 |
| 80% | 79.8% | 152,641 | 152,182 |
| 70% | 70.7% | 133,561 | 134,842 |
| 60% | 60.1% | 114,481 | 114,591 |
| 50% | 50.2% | 95,401 | 95,758 |
| 40% | 40.3% | 76,320 | 76,801 |
| 30% | 30.0% | 57,240 | 57,300 |
| 20% | 19.9% | 38,160 | 37,979 |
| 10% | 10.0% | 19,080 | 18,987 |
| Active Idle | 0 | 0 | |