SPECpower_ssj2008
Host 'node4' Performance Report
Copyright © 2007-2020 Standard Performance Evaluation Corporation
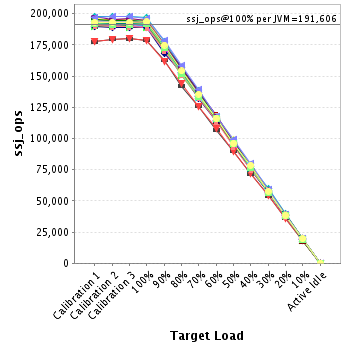
| ASUSTeK Computer Inc. RS620SA-E10-RS12 | ssj_ops@100% = 6,131,378 ssj_ops@100% per JVM = 191,606 |
||||
| Test Sponsor: | ASUSTeK Computer Inc. | SPEC License #: | 9016 | Test Method: | Multi Node |
| Tested By: | ASUSTeK Computer Inc. | Test Location: | Taipei, Taiwan. | Test Date: | Sep 18, 2020 |
| Hardware Availability: | Sep-2020 | Software Availability: | Jul-2020 | Publication: | Oct 7, 2020 |
| System Source: | Single Supplier | System Designation: | Server | Power Provisioning: | Line-powered |
| Target Load | Actual Load | ssj_ops | |
|---|---|---|---|
| Target | Actual | ||
| Calibration 1 | 6,155,816 | ||
| Calibration 2 | 6,150,843 | ||
| Calibration 3 | 6,155,317 | ||
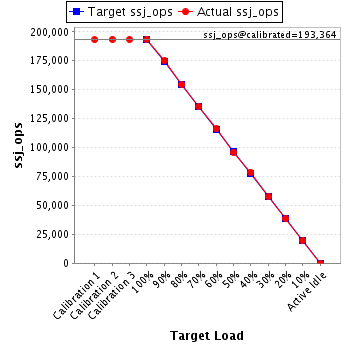
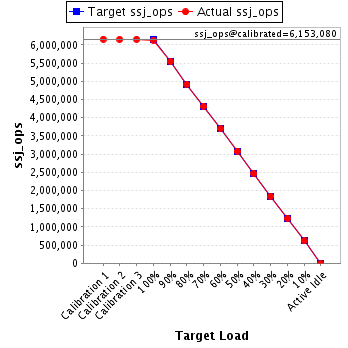
| ssj_ops@calibrated=6,153,080 | |||
| 100% | 99.6% | 6,153,080 | 6,131,378 |
| 90% | 90.1% | 5,537,772 | 5,542,712 |
| 80% | 79.9% | 4,922,464 | 4,917,759 |
| 70% | 70.1% | 4,307,156 | 4,314,829 |
| 60% | 60.0% | 3,691,848 | 3,691,496 |
| 50% | 50.1% | 3,076,540 | 3,081,119 |
| 40% | 40.0% | 2,461,232 | 2,461,798 |
| 30% | 30.0% | 1,845,924 | 1,844,988 |
| 20% | 20.0% | 1,230,616 | 1,231,362 |
| 10% | 10.0% | 615,308 | 614,527 |
| Active Idle | 0 | 0 | |
| Set Identifier: | RS620SA-E10-RS12 |
| Set Description: | System Under Test |
| # of Identical Nodes: | 6 |
| Comment: | 'SUT' |
| Hardware | |
|---|---|
| Hardware Vendor: | ASUSTeK Computer Inc. |
| Model: | RS620SA-E10-RS12 |
| Form Factor: | 1U |
| CPU Name: | AMD EPYC 7742 2.25Ghz |
| CPU Characteristics: | 64-Core, 2.25GHz, 256MB L3 Cache |
| CPU Frequency (MHz): | 2250 |
| CPU(s) Enabled: | 64 cores, 1 chip, 64 cores/chip |
| Hardware Threads: | 128 (2 / core) |
| CPU(s) Orderable: | 1 chip |
| Primary Cache: | 32 KB I + 32 KB D on chip per core |
| Secondary Cache: | 512 KB I+D on chip per core |
| Tertiary Cache: | 256 MB I+D on chip per chip, 16 MB shared / 4 cores |
| Other Cache: | None |
| Memory Amount (GB): | 128 |
| # and size of DIMM: | 8 x 16 GB |
| Memory Details: | 8 x 16GB 2Rx8 PC4-3200AA-R ECC RDIMM; all slots populated |
| Power Supply Quantity and Rating (W): | None |
| Power Supply Details: | Shared |
| Disk Drive: | 1 x 240GB Seagate Nytro 510DCT M.2 PCIE SSD P/N: 03B03-00130200 |
| Disk Controller: | Integrated PCIE controller |
| # and type of Network Interface Cards (NICs) Installed: | 1 x Intel I210 Gigabit Ethernet controller |
| NICs Enabled in Firmware / OS / Connected: | 1/1/1 |
| Network Speed (Mbit): | 1000 |
| Keyboard: | None |
| Mouse: | None |
| Monitor: | None |
| Optical Drives: | No |
| Other Hardware: | None |
| Software | |
|---|---|
| Power Management: | Enabled(See SUT Notes) |
| Operating System (OS): | Suse Linux Enterprise Server 15 SP1 |
| OS Version: | 4.12.14-195-default |
| Filesystem: | xfs |
| JVM Vendor: | Oracle |
| JVM Version: | Java HotSpot(TM) 64-Bit Server VM (build 14.0.2+12-46, mixed mode, sharing), version 14.0.2 |
| JVM Command-line Options: | -server -Xmn1200m -Xms1400m -Xmx1400m -XX:MaxTenuringThreshold=1 -XX:ParallelGCThreads=2 -XX:InlineSmallCode=4000 -XX:MaxInlineSize=300 -XX:FreqInlineSize=3000 -XX:+UseParallelGC -XX:+UseLargePages -XX:+UseHugeTLBFS -XX:+UseTransparentHugePages |
| JVM Affinity: | for each two physicalCores { numactl -C physicalCoreId, physicalCoreId + 1, physicalCoreId + 64, physicalCoreId + 65 -l } |
| JVM Instances: | 32 |
| JVM Initial Heap (MB): | 1400 |
| JVM Maximum Heap (MB): | 1400 |
| JVM Address Bits: | 64 |
| Boot Firmware Version: | 0305 |
| Management Firmware Version: | 2.1.09 |
| Workload Version: | SSJ 1.2.10 |
| Director Location: | Controller |
| Other Software: | None |
| JVM Instance | ssj_ops@100% |
|---|---|
| node4.001 | 190,337 |
| node4.002 | 193,539 |
| node4.003 | 194,727 |
| node4.004 | 194,271 |
| node4.005 | 189,865 |
| node4.006 | 193,476 |
| node4.007 | 192,974 |
| node4.008 | 192,240 |
| node4.009 | 195,605 |
| node4.010 | 190,227 |
| node4.011 | 189,589 |
| node4.012 | 192,694 |
| node4.013 | 193,346 |
| node4.014 | 197,059 |
| node4.015 | 178,943 |
| node4.016 | 178,802 |
| node4.017 | 193,375 |
| node4.018 | 188,818 |
| node4.019 | 195,179 |
| node4.020 | 189,288 |
| node4.021 | 190,348 |
| node4.022 | 191,955 |
| node4.023 | 192,213 |
| node4.024 | 188,741 |
| node4.025 | 193,798 |
| node4.026 | 191,799 |
| node4.027 | 194,832 |
| node4.028 | 192,198 |
| node4.029 | 189,032 |
| node4.030 | 196,544 |
| node4.031 | 191,908 |
| node4.032 | 193,656 |
| ssj_ops@100% | 6,131,378 |
| ssj_ops@100% per JVM | 191,606 |
| Target Load | Actual Load | ssj_ops | |
|---|---|---|---|
| Target | Actual | ||
| Calibration 1 | 192,419 | ||
| Calibration 2 | 191,555 | ||
| Calibration 3 | 191,404 | ||
| ssj_ops@calibrated=191,479 | |||
| 100% | 99.4% | 191,479 | 190,337 |
| 90% | 90.3% | 172,331 | 173,000 |
| 80% | 80.7% | 153,183 | 154,548 |
| 70% | 70.6% | 134,035 | 135,094 |
| 60% | 60.3% | 114,888 | 115,378 |
| 50% | 50.2% | 95,740 | 96,179 |
| 40% | 40.4% | 76,592 | 77,446 |
| 30% | 30.3% | 57,444 | 57,956 |
| 20% | 20.1% | 38,296 | 38,474 |
| 10% | 9.9% | 19,148 | 19,025 |
| Active Idle | 0 | 0 | |

| Target Load | Actual Load | ssj_ops | |
|---|---|---|---|
| Target | Actual | ||
| Calibration 1 | 193,774 | ||
| Calibration 2 | 193,942 | ||
| Calibration 3 | 193,952 | ||
| ssj_ops@calibrated=193,947 | |||
| 100% | 99.8% | 193,947 | 193,539 |
| 90% | 89.9% | 174,552 | 174,396 |
| 80% | 79.6% | 155,157 | 154,346 |
| 70% | 70.2% | 135,763 | 136,097 |
| 60% | 59.7% | 116,368 | 115,772 |
| 50% | 50.6% | 96,973 | 98,131 |
| 40% | 39.9% | 77,579 | 77,295 |
| 30% | 30.0% | 58,184 | 58,172 |
| 20% | 20.0% | 38,789 | 38,825 |
| 10% | 9.9% | 19,395 | 19,125 |
| Active Idle | 0 | 0 | |

| Target Load | Actual Load | ssj_ops | |
|---|---|---|---|
| Target | Actual | ||
| Calibration 1 | 194,902 | ||
| Calibration 2 | 195,303 | ||
| Calibration 3 | 195,330 | ||
| ssj_ops@calibrated=195,317 | |||
| 100% | 99.7% | 195,317 | 194,727 |
| 90% | 89.9% | 175,785 | 175,530 |
| 80% | 80.2% | 156,254 | 156,711 |
| 70% | 69.7% | 136,722 | 136,132 |
| 60% | 60.3% | 117,190 | 117,824 |
| 50% | 50.3% | 97,658 | 98,318 |
| 40% | 40.0% | 78,127 | 78,149 |
| 30% | 29.7% | 58,595 | 58,064 |
| 20% | 20.1% | 39,063 | 39,311 |
| 10% | 10.1% | 19,532 | 19,717 |
| Active Idle | 0 | 0 | |

| Target Load | Actual Load | ssj_ops | |
|---|---|---|---|
| Target | Actual | ||
| Calibration 1 | 196,060 | ||
| Calibration 2 | 194,467 | ||
| Calibration 3 | 195,447 | ||
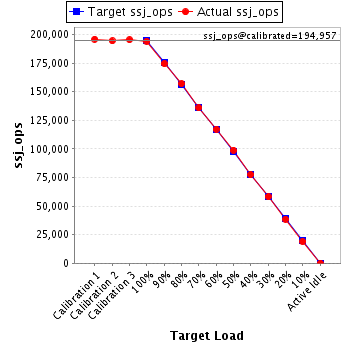
| ssj_ops@calibrated=194,957 | |||
| 100% | 99.6% | 194,957 | 194,271 |
| 90% | 89.5% | 175,461 | 174,533 |
| 80% | 80.5% | 155,966 | 157,035 |
| 70% | 69.7% | 136,470 | 135,939 |
| 60% | 60.2% | 116,974 | 117,370 |
| 50% | 50.8% | 97,479 | 98,960 |
| 40% | 39.7% | 77,983 | 77,408 |
| 30% | 29.9% | 58,487 | 58,227 |
| 20% | 19.8% | 38,991 | 38,608 |
| 10% | 9.7% | 19,496 | 18,998 |
| Active Idle | 0 | 0 | |
| Target Load | Actual Load | ssj_ops | |
|---|---|---|---|
| Target | Actual | ||
| Calibration 1 | 190,190 | ||
| Calibration 2 | 189,716 | ||
| Calibration 3 | 189,839 | ||
| ssj_ops@calibrated=189,778 | |||
| 100% | 100.0% | 189,778 | 189,865 |
| 90% | 89.7% | 170,800 | 170,194 |
| 80% | 79.9% | 151,822 | 151,538 |
| 70% | 70.4% | 132,844 | 133,644 |
| 60% | 59.9% | 113,867 | 113,638 |
| 50% | 50.1% | 94,889 | 95,170 |
| 40% | 40.1% | 75,911 | 76,028 |
| 30% | 30.2% | 56,933 | 57,224 |
| 20% | 20.0% | 37,956 | 37,905 |
| 10% | 9.8% | 18,978 | 18,662 |
| Active Idle | 0 | 0 | |

| Target Load | Actual Load | ssj_ops | |
|---|---|---|---|
| Target | Actual | ||
| Calibration 1 | 195,325 | ||
| Calibration 2 | 194,194 | ||
| Calibration 3 | 194,349 | ||
| ssj_ops@calibrated=194,271 | |||
| 100% | 99.6% | 194,271 | 193,476 |
| 90% | 89.8% | 174,844 | 174,387 |
| 80% | 79.8% | 155,417 | 155,078 |
| 70% | 70.7% | 135,990 | 137,277 |
| 60% | 60.3% | 116,563 | 117,123 |
| 50% | 50.0% | 97,136 | 97,068 |
| 40% | 40.4% | 77,709 | 78,552 |
| 30% | 29.8% | 58,281 | 57,912 |
| 20% | 19.7% | 38,854 | 38,342 |
| 10% | 10.1% | 19,427 | 19,641 |
| Active Idle | 0 | 0 | |

| Target Load | Actual Load | ssj_ops | |
|---|---|---|---|
| Target | Actual | ||
| Calibration 1 | 194,445 | ||
| Calibration 2 | 193,489 | ||
| Calibration 3 | 193,932 | ||
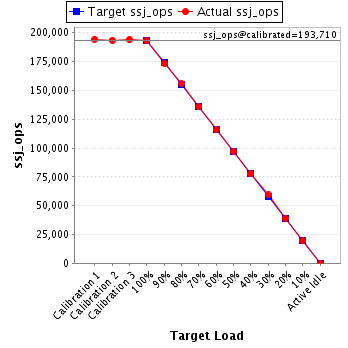
| ssj_ops@calibrated=193,710 | |||
| 100% | 99.6% | 193,710 | 192,974 |
| 90% | 89.7% | 174,339 | 173,708 |
| 80% | 80.3% | 154,968 | 155,578 |
| 70% | 70.1% | 135,597 | 135,828 |
| 60% | 59.9% | 116,226 | 115,960 |
| 50% | 50.2% | 96,855 | 97,294 |
| 40% | 40.1% | 77,484 | 77,705 |
| 30% | 30.7% | 58,113 | 59,391 |
| 20% | 20.2% | 38,742 | 39,110 |
| 10% | 10.1% | 19,371 | 19,579 |
| Active Idle | 0 | 0 | |
| Target Load | Actual Load | ssj_ops | |
|---|---|---|---|
| Target | Actual | ||
| Calibration 1 | 192,812 | ||
| Calibration 2 | 192,445 | ||
| Calibration 3 | 192,571 | ||
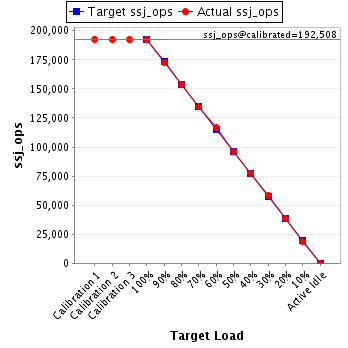
| ssj_ops@calibrated=192,508 | |||
| 100% | 99.9% | 192,508 | 192,240 |
| 90% | 89.7% | 173,257 | 172,644 |
| 80% | 80.0% | 154,006 | 154,031 |
| 70% | 69.9% | 134,755 | 134,579 |
| 60% | 60.5% | 115,505 | 116,419 |
| 50% | 49.8% | 96,254 | 95,782 |
| 40% | 40.1% | 77,003 | 77,239 |
| 30% | 30.2% | 57,752 | 58,067 |
| 20% | 20.0% | 38,502 | 38,475 |
| 10% | 9.9% | 19,251 | 18,996 |
| Active Idle | 0 | 0 | |
| Target Load | Actual Load | ssj_ops | |
|---|---|---|---|
| Target | Actual | ||
| Calibration 1 | 195,711 | ||
| Calibration 2 | 195,363 | ||
| Calibration 3 | 195,615 | ||
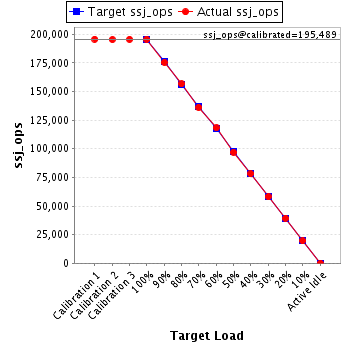
| ssj_ops@calibrated=195,489 | |||
| 100% | 100.1% | 195,489 | 195,605 |
| 90% | 89.7% | 175,940 | 175,448 |
| 80% | 80.1% | 156,391 | 156,566 |
| 70% | 69.6% | 136,842 | 136,133 |
| 60% | 60.5% | 117,293 | 118,212 |
| 50% | 49.6% | 97,744 | 97,019 |
| 40% | 39.9% | 78,196 | 78,055 |
| 30% | 29.7% | 58,647 | 58,107 |
| 20% | 20.2% | 39,098 | 39,470 |
| 10% | 10.0% | 19,549 | 19,565 |
| Active Idle | 0 | 0 | |
| Target Load | Actual Load | ssj_ops | |
|---|---|---|---|
| Target | Actual | ||
| Calibration 1 | 191,621 | ||
| Calibration 2 | 191,116 | ||
| Calibration 3 | 190,862 | ||
| ssj_ops@calibrated=190,989 | |||
| 100% | 99.6% | 190,989 | 190,227 |
| 90% | 90.4% | 171,890 | 172,717 |
| 80% | 80.2% | 152,792 | 153,229 |
| 70% | 70.0% | 133,693 | 133,682 |
| 60% | 59.9% | 114,594 | 114,331 |
| 50% | 50.0% | 95,495 | 95,568 |
| 40% | 39.7% | 76,396 | 75,867 |
| 30% | 29.8% | 57,297 | 56,885 |
| 20% | 20.0% | 38,198 | 38,176 |
| 10% | 10.0% | 19,099 | 19,165 |
| Active Idle | 0 | 0 | |

| Target Load | Actual Load | ssj_ops | |
|---|---|---|---|
| Target | Actual | ||
| Calibration 1 | 190,819 | ||
| Calibration 2 | 190,549 | ||
| Calibration 3 | 190,564 | ||
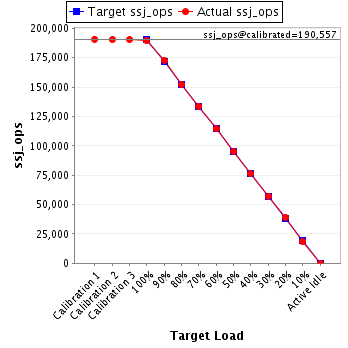
| ssj_ops@calibrated=190,557 | |||
| 100% | 99.5% | 190,557 | 189,589 |
| 90% | 90.7% | 171,501 | 172,846 |
| 80% | 79.9% | 152,445 | 152,201 |
| 70% | 70.2% | 133,390 | 133,820 |
| 60% | 60.0% | 114,334 | 114,356 |
| 50% | 50.1% | 95,278 | 95,420 |
| 40% | 40.1% | 76,223 | 76,366 |
| 30% | 30.0% | 57,167 | 57,246 |
| 20% | 20.4% | 38,111 | 38,885 |
| 10% | 9.8% | 19,056 | 18,626 |
| Active Idle | 0 | 0 | |
| Target Load | Actual Load | ssj_ops | |
|---|---|---|---|
| Target | Actual | ||
| Calibration 1 | 193,266 | ||
| Calibration 2 | 194,279 | ||
| Calibration 3 | 194,319 | ||
| ssj_ops@calibrated=194,299 | |||
| 100% | 99.2% | 194,299 | 192,694 |
| 90% | 90.8% | 174,869 | 176,338 |
| 80% | 80.2% | 155,439 | 155,737 |
| 70% | 71.1% | 136,009 | 138,088 |
| 60% | 60.6% | 116,579 | 117,672 |
| 50% | 50.0% | 97,150 | 97,078 |
| 40% | 40.1% | 77,720 | 77,832 |
| 30% | 30.0% | 58,290 | 58,258 |
| 20% | 19.8% | 38,860 | 38,442 |
| 10% | 9.9% | 19,430 | 19,167 |
| Active Idle | 0 | 0 | |

| Target Load | Actual Load | ssj_ops | |
|---|---|---|---|
| Target | Actual | ||
| Calibration 1 | 194,011 | ||
| Calibration 2 | 194,177 | ||
| Calibration 3 | 194,586 | ||
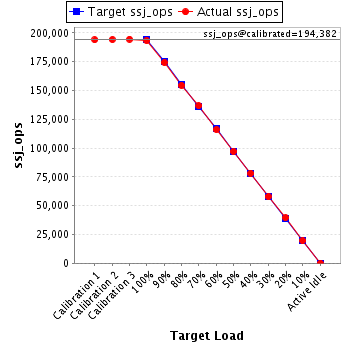
| ssj_ops@calibrated=194,382 | |||
| 100% | 99.5% | 194,382 | 193,346 |
| 90% | 89.7% | 174,944 | 174,372 |
| 80% | 79.5% | 155,505 | 154,438 |
| 70% | 70.4% | 136,067 | 136,785 |
| 60% | 59.7% | 116,629 | 116,042 |
| 50% | 50.0% | 97,191 | 97,180 |
| 40% | 40.2% | 77,753 | 78,150 |
| 30% | 29.8% | 58,315 | 57,835 |
| 20% | 20.3% | 38,876 | 39,424 |
| 10% | 10.1% | 19,438 | 19,596 |
| Active Idle | 0 | 0 | |
| Target Load | Actual Load | ssj_ops | |
|---|---|---|---|
| Target | Actual | ||
| Calibration 1 | 197,698 | ||
| Calibration 2 | 197,495 | ||
| Calibration 3 | 197,714 | ||
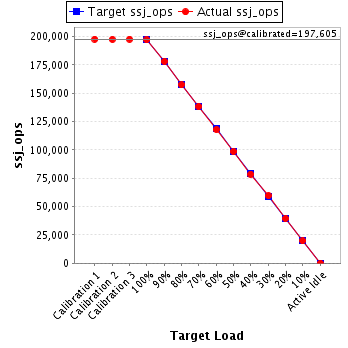
| ssj_ops@calibrated=197,605 | |||
| 100% | 99.7% | 197,605 | 197,059 |
| 90% | 90.1% | 177,844 | 178,091 |
| 80% | 79.6% | 158,084 | 157,305 |
| 70% | 70.0% | 138,323 | 138,281 |
| 60% | 59.7% | 118,563 | 117,926 |
| 50% | 49.9% | 98,802 | 98,690 |
| 40% | 39.8% | 79,042 | 78,626 |
| 30% | 30.2% | 59,281 | 59,615 |
| 20% | 20.0% | 39,521 | 39,515 |
| 10% | 10.0% | 19,760 | 19,742 |
| Active Idle | 0 | 0 | |
| Target Load | Actual Load | ssj_ops | |
|---|---|---|---|
| Target | Actual | ||
| Calibration 1 | 177,777 | ||
| Calibration 2 | 179,770 | ||
| Calibration 3 | 180,107 | ||
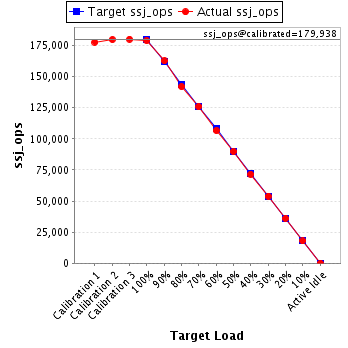
| ssj_ops@calibrated=179,938 | |||
| 100% | 99.4% | 179,938 | 178,943 |
| 90% | 90.4% | 161,944 | 162,617 |
| 80% | 78.9% | 143,951 | 141,889 |
| 70% | 69.9% | 125,957 | 125,854 |
| 60% | 59.3% | 107,963 | 106,636 |
| 50% | 50.0% | 89,969 | 89,918 |
| 40% | 39.8% | 71,975 | 71,579 |
| 30% | 30.0% | 53,981 | 53,932 |
| 20% | 20.1% | 35,988 | 36,192 |
| 10% | 10.0% | 17,994 | 17,929 |
| Active Idle | 0 | 0 | |
| Target Load | Actual Load | ssj_ops | |
|---|---|---|---|
| Target | Actual | ||
| Calibration 1 | 177,459 | ||
| Calibration 2 | 179,452 | ||
| Calibration 3 | 179,881 | ||
| ssj_ops@calibrated=179,667 | |||
| 100% | 99.5% | 179,667 | 178,802 |
| 90% | 90.2% | 161,700 | 162,138 |
| 80% | 80.3% | 143,733 | 144,309 |
| 70% | 70.0% | 125,767 | 125,776 |
| 60% | 60.0% | 107,800 | 107,880 |
| 50% | 49.7% | 89,833 | 89,329 |
| 40% | 40.1% | 71,867 | 72,045 |
| 30% | 30.0% | 53,900 | 53,968 |
| 20% | 19.8% | 35,933 | 35,487 |
| 10% | 10.0% | 17,967 | 18,008 |
| Active Idle | 0 | 0 | |

| Target Load | Actual Load | ssj_ops | |
|---|---|---|---|
| Target | Actual | ||
| Calibration 1 | 193,933 | ||
| Calibration 2 | 194,559 | ||
| Calibration 3 | 193,925 | ||
| ssj_ops@calibrated=194,242 | |||
| 100% | 99.6% | 194,242 | 193,375 |
| 90% | 89.6% | 174,818 | 174,023 |
| 80% | 80.0% | 155,394 | 155,427 |
| 70% | 70.2% | 135,970 | 136,277 |
| 60% | 59.6% | 116,545 | 115,707 |
| 50% | 50.7% | 97,121 | 98,525 |
| 40% | 39.9% | 77,697 | 77,587 |
| 30% | 29.5% | 58,273 | 57,287 |
| 20% | 20.0% | 38,848 | 38,830 |
| 10% | 10.0% | 19,424 | 19,367 |
| Active Idle | 0 | 0 | |

| Target Load | Actual Load | ssj_ops | |
|---|---|---|---|
| Target | Actual | ||
| Calibration 1 | 190,000 | ||
| Calibration 2 | 190,129 | ||
| Calibration 3 | 189,335 | ||
| ssj_ops@calibrated=189,732 | |||
| 100% | 99.5% | 189,732 | 188,818 |
| 90% | 90.5% | 170,759 | 171,675 |
| 80% | 79.5% | 151,786 | 150,841 |
| 70% | 70.2% | 132,812 | 133,202 |
| 60% | 60.4% | 113,839 | 114,564 |
| 50% | 50.5% | 94,866 | 95,744 |
| 40% | 39.9% | 75,893 | 75,683 |
| 30% | 30.1% | 56,920 | 57,035 |
| 20% | 20.1% | 37,946 | 38,116 |
| 10% | 9.8% | 18,973 | 18,528 |
| Active Idle | 0 | 0 | |

| Target Load | Actual Load | ssj_ops | |
|---|---|---|---|
| Target | Actual | ||
| Calibration 1 | 196,071 | ||
| Calibration 2 | 194,706 | ||
| Calibration 3 | 195,151 | ||
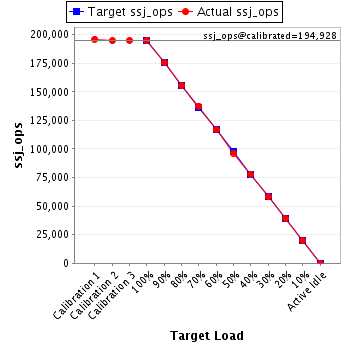
| ssj_ops@calibrated=194,928 | |||
| 100% | 100.1% | 194,928 | 195,179 |
| 90% | 90.0% | 175,435 | 175,384 |
| 80% | 79.8% | 155,943 | 155,584 |
| 70% | 70.6% | 136,450 | 137,587 |
| 60% | 59.9% | 116,957 | 116,775 |
| 50% | 49.5% | 97,464 | 96,436 |
| 40% | 40.0% | 77,971 | 78,012 |
| 30% | 29.8% | 58,478 | 58,085 |
| 20% | 20.0% | 38,986 | 38,928 |
| 10% | 10.2% | 19,493 | 19,793 |
| Active Idle | 0 | 0 | |
| Target Load | Actual Load | ssj_ops | |
|---|---|---|---|
| Target | Actual | ||
| Calibration 1 | 191,161 | ||
| Calibration 2 | 190,633 | ||
| Calibration 3 | 191,466 | ||
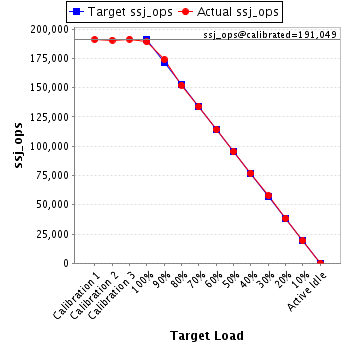
| ssj_ops@calibrated=191,049 | |||
| 100% | 99.1% | 191,049 | 189,288 |
| 90% | 91.1% | 171,944 | 173,970 |
| 80% | 79.6% | 152,840 | 152,158 |
| 70% | 70.1% | 133,735 | 133,846 |
| 60% | 59.9% | 114,630 | 114,374 |
| 50% | 49.9% | 95,525 | 95,389 |
| 40% | 40.3% | 76,420 | 76,964 |
| 30% | 30.2% | 57,315 | 57,696 |
| 20% | 20.1% | 38,210 | 38,450 |
| 10% | 10.1% | 19,105 | 19,283 |
| Active Idle | 0 | 0 | |
| Target Load | Actual Load | ssj_ops | |
|---|---|---|---|
| Target | Actual | ||
| Calibration 1 | 191,992 | ||
| Calibration 2 | 191,519 | ||
| Calibration 3 | 191,549 | ||
| ssj_ops@calibrated=191,534 | |||
| 100% | 99.4% | 191,534 | 190,348 |
| 90% | 90.9% | 172,380 | 174,065 |
| 80% | 79.5% | 153,227 | 152,229 |
| 70% | 69.6% | 134,074 | 133,264 |
| 60% | 59.9% | 114,920 | 114,663 |
| 50% | 50.1% | 95,767 | 95,970 |
| 40% | 40.0% | 76,614 | 76,529 |
| 30% | 29.7% | 57,460 | 56,978 |
| 20% | 19.8% | 38,307 | 37,955 |
| 10% | 10.0% | 19,153 | 19,164 |
| Active Idle | 0 | 0 | |

| Target Load | Actual Load | ssj_ops | |
|---|---|---|---|
| Target | Actual | ||
| Calibration 1 | 193,509 | ||
| Calibration 2 | 193,641 | ||
| Calibration 3 | 194,073 | ||
| ssj_ops@calibrated=193,857 | |||
| 100% | 99.0% | 193,857 | 191,955 |
| 90% | 90.7% | 174,471 | 175,885 |
| 80% | 79.7% | 155,086 | 154,594 |
| 70% | 69.9% | 135,700 | 135,487 |
| 60% | 60.5% | 116,314 | 117,282 |
| 50% | 50.4% | 96,928 | 97,722 |
| 40% | 39.0% | 77,543 | 75,649 |
| 30% | 30.2% | 58,157 | 58,470 |
| 20% | 20.2% | 38,771 | 39,152 |
| 10% | 10.1% | 19,386 | 19,567 |
| Active Idle | 0 | 0 | |

| Target Load | Actual Load | ssj_ops | |
|---|---|---|---|
| Target | Actual | ||
| Calibration 1 | 192,251 | ||
| Calibration 2 | 192,661 | ||
| Calibration 3 | 192,855 | ||
| ssj_ops@calibrated=192,758 | |||
| 100% | 99.7% | 192,758 | 192,213 |
| 90% | 90.3% | 173,482 | 174,048 |
| 80% | 79.7% | 154,206 | 153,599 |
| 70% | 69.6% | 134,931 | 134,115 |
| 60% | 59.6% | 115,655 | 114,788 |
| 50% | 50.8% | 96,379 | 97,922 |
| 40% | 40.1% | 77,103 | 77,265 |
| 30% | 30.5% | 57,827 | 58,723 |
| 20% | 19.9% | 38,552 | 38,268 |
| 10% | 9.5% | 19,276 | 18,397 |
| Active Idle | 0 | 0 | |

| Target Load | Actual Load | ssj_ops | |
|---|---|---|---|
| Target | Actual | ||
| Calibration 1 | 189,415 | ||
| Calibration 2 | 188,941 | ||
| Calibration 3 | 188,683 | ||
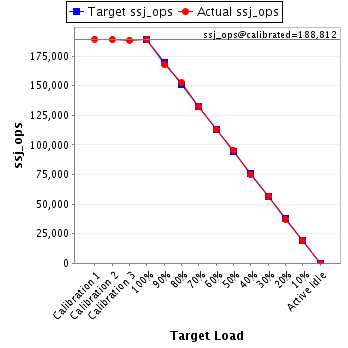
| ssj_ops@calibrated=188,812 | |||
| 100% | 100.0% | 188,812 | 188,741 |
| 90% | 89.1% | 169,931 | 168,257 |
| 80% | 80.9% | 151,049 | 152,677 |
| 70% | 70.2% | 132,168 | 132,468 |
| 60% | 60.1% | 113,287 | 113,463 |
| 50% | 50.5% | 94,406 | 95,321 |
| 40% | 39.8% | 75,525 | 75,208 |
| 30% | 30.1% | 56,644 | 56,748 |
| 20% | 19.8% | 37,762 | 37,393 |
| 10% | 10.2% | 18,881 | 19,349 |
| Active Idle | 0 | 0 | |
| Target Load | Actual Load | ssj_ops | |
|---|---|---|---|
| Target | Actual | ||
| Calibration 1 | 195,578 | ||
| Calibration 2 | 194,823 | ||
| Calibration 3 | 194,871 | ||
| ssj_ops@calibrated=194,847 | |||
| 100% | 99.5% | 194,847 | 193,798 |
| 90% | 89.5% | 175,362 | 174,472 |
| 80% | 80.0% | 155,878 | 155,921 |
| 70% | 70.5% | 136,393 | 137,315 |
| 60% | 59.5% | 116,908 | 115,971 |
| 50% | 49.8% | 97,423 | 97,104 |
| 40% | 40.2% | 77,939 | 78,240 |
| 30% | 30.0% | 58,454 | 58,381 |
| 20% | 19.9% | 38,969 | 38,854 |
| 10% | 10.0% | 19,485 | 19,532 |
| Active Idle | 0 | 0 | |

| Target Load | Actual Load | ssj_ops | |
|---|---|---|---|
| Target | Actual | ||
| Calibration 1 | 191,115 | ||
| Calibration 2 | 191,732 | ||
| Calibration 3 | 191,957 | ||
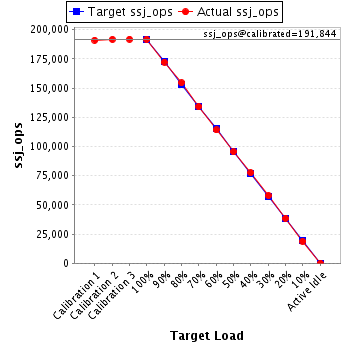
| ssj_ops@calibrated=191,844 | |||
| 100% | 100.0% | 191,844 | 191,799 |
| 90% | 89.8% | 172,660 | 172,349 |
| 80% | 80.5% | 153,475 | 154,475 |
| 70% | 69.9% | 134,291 | 134,156 |
| 60% | 59.5% | 115,107 | 114,154 |
| 50% | 49.7% | 95,922 | 95,426 |
| 40% | 40.4% | 76,738 | 77,549 |
| 30% | 30.2% | 57,553 | 57,933 |
| 20% | 20.1% | 38,369 | 38,598 |
| 10% | 9.8% | 19,184 | 18,892 |
| Active Idle | 0 | 0 | |
| Target Load | Actual Load | ssj_ops | |
|---|---|---|---|
| Target | Actual | ||
| Calibration 1 | 197,437 | ||
| Calibration 2 | 195,442 | ||
| Calibration 3 | 195,962 | ||
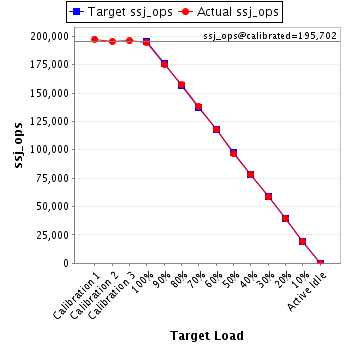
| ssj_ops@calibrated=195,702 | |||
| 100% | 99.6% | 195,702 | 194,832 |
| 90% | 89.6% | 176,132 | 175,434 |
| 80% | 80.4% | 156,562 | 157,322 |
| 70% | 70.5% | 136,992 | 138,008 |
| 60% | 60.4% | 117,421 | 118,127 |
| 50% | 49.4% | 97,851 | 96,721 |
| 40% | 39.8% | 78,281 | 77,914 |
| 30% | 29.9% | 58,711 | 58,439 |
| 20% | 20.1% | 39,140 | 39,427 |
| 10% | 9.9% | 19,570 | 19,422 |
| Active Idle | 0 | 0 | |
| Target Load | Actual Load | ssj_ops | |
|---|---|---|---|
| Target | Actual | ||
| Calibration 1 | 192,423 | ||
| Calibration 2 | 192,201 | ||
| Calibration 3 | 192,242 | ||
| ssj_ops@calibrated=192,222 | |||
| 100% | 100.0% | 192,222 | 192,198 |
| 90% | 90.2% | 173,000 | 173,387 |
| 80% | 79.4% | 153,777 | 152,662 |
| 70% | 70.4% | 134,555 | 135,303 |
| 60% | 60.0% | 115,333 | 115,361 |
| 50% | 50.3% | 96,111 | 96,667 |
| 40% | 39.6% | 76,889 | 76,069 |
| 30% | 30.0% | 57,667 | 57,670 |
| 20% | 20.2% | 38,444 | 38,783 |
| 10% | 10.3% | 19,222 | 19,727 |
| Active Idle | 0 | 0 | |

| Target Load | Actual Load | ssj_ops | |
|---|---|---|---|
| Target | Actual | ||
| Calibration 1 | 190,650 | ||
| Calibration 2 | 189,817 | ||
| Calibration 3 | 189,746 | ||
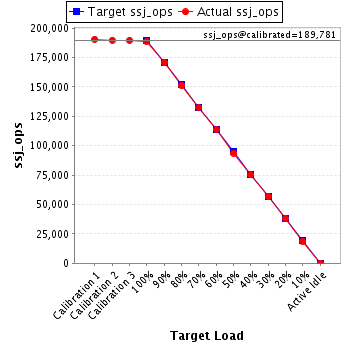
| ssj_ops@calibrated=189,781 | |||
| 100% | 99.6% | 189,781 | 189,032 |
| 90% | 90.0% | 170,803 | 170,817 |
| 80% | 79.6% | 151,825 | 151,036 |
| 70% | 69.8% | 132,847 | 132,540 |
| 60% | 60.0% | 113,869 | 113,879 |
| 50% | 49.4% | 94,891 | 93,804 |
| 40% | 39.7% | 75,912 | 75,333 |
| 30% | 30.1% | 56,934 | 57,143 |
| 20% | 19.9% | 37,956 | 37,746 |
| 10% | 10.0% | 18,978 | 18,923 |
| Active Idle | 0 | 0 | |
| Target Load | Actual Load | ssj_ops | |
|---|---|---|---|
| Target | Actual | ||
| Calibration 1 | 196,754 | ||
| Calibration 2 | 197,817 | ||
| Calibration 3 | 197,956 | ||
| ssj_ops@calibrated=197,886 | |||
| 100% | 99.3% | 197,886 | 196,544 |
| 90% | 90.2% | 178,098 | 178,442 |
| 80% | 80.0% | 158,309 | 158,385 |
| 70% | 70.4% | 138,520 | 139,272 |
| 60% | 59.6% | 118,732 | 117,904 |
| 50% | 50.3% | 98,943 | 99,553 |
| 40% | 40.3% | 79,155 | 79,731 |
| 30% | 29.8% | 59,366 | 58,877 |
| 20% | 19.8% | 39,577 | 39,278 |
| 10% | 10.2% | 19,789 | 20,242 |
| Active Idle | 0 | 0 | |

| Target Load | Actual Load | ssj_ops | |
|---|---|---|---|
| Target | Actual | ||
| Calibration 1 | 192,086 | ||
| Calibration 2 | 191,563 | ||
| Calibration 3 | 191,693 | ||
| ssj_ops@calibrated=191,628 | |||
| 100% | 100.1% | 191,628 | 191,908 |
| 90% | 90.1% | 172,465 | 172,596 |
| 80% | 79.4% | 153,303 | 152,106 |
| 70% | 69.6% | 134,140 | 133,418 |
| 60% | 60.4% | 114,977 | 115,817 |
| 50% | 49.9% | 95,814 | 95,716 |
| 40% | 40.2% | 76,651 | 77,086 |
| 30% | 29.7% | 57,488 | 56,973 |
| 20% | 20.1% | 38,326 | 38,467 |
| 10% | 10.0% | 19,163 | 19,171 |
| Active Idle | 0 | 0 | |

| Target Load | Actual Load | ssj_ops | |
|---|---|---|---|
| Target | Actual | ||
| Calibration 1 | 193,152 | ||
| Calibration 2 | 193,346 | ||
| Calibration 3 | 193,382 | ||
| ssj_ops@calibrated=193,364 | |||
| 100% | 100.2% | 193,364 | 193,656 |
| 90% | 90.5% | 174,028 | 174,948 |
| 80% | 79.7% | 154,691 | 154,205 |
| 70% | 70.1% | 135,355 | 135,562 |
| 60% | 60.1% | 116,018 | 116,126 |
| 50% | 49.6% | 96,682 | 95,996 |
| 40% | 40.7% | 77,346 | 78,639 |
| 30% | 29.8% | 58,009 | 57,692 |
| 20% | 19.9% | 38,673 | 38,480 |
| 10% | 10.2% | 19,336 | 19,629 |
| Active Idle | 0 | 0 | |