
SPECpower_ssj2008
Host 'localhost' Performance Report
Copyright © 2007-2020 Standard Performance Evaluation Corporation
| Hewlett Packard Enterprise Superdome Flex 280 - 4 Socket | ssj_ops@100% = 10,116,731 ssj_ops@100% per JVM = 1,264,591 |
||||
| Test Sponsor: | Hewlett Packard Enterprise | SPEC License #: | 3 | Test Method: | Single Node |
| Tested By: | Hewlett Packard Enterprise | Test Location: | Houston, TX, USA | Test Date: | Oct 19, 2020 |
| Hardware Availability: | Dec-2020 | Software Availability: | Jul-2020 | Publication: | Nov 4, 2020 |
| System Source: | Single Supplier | System Designation: | Server | Power Provisioning: | Line-powered |
| Target Load | Actual Load | ssj_ops | |
|---|---|---|---|
| Target | Actual | ||
| Calibration 1 | 10,191,918 | ||
| Calibration 2 | 10,153,866 | ||
| Calibration 3 | 10,159,347 | ||
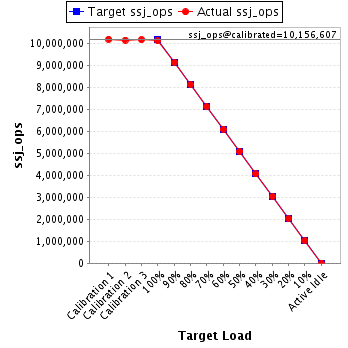
| ssj_ops@calibrated=10,156,607 | |||
| 100% | 99.6% | 10,156,607 | 10,116,731 |
| 90% | 90.0% | 9,140,946 | 9,138,520 |
| 80% | 79.9% | 8,125,285 | 8,116,351 |
| 70% | 70.0% | 7,109,625 | 7,111,616 |
| 60% | 60.0% | 6,093,964 | 6,097,225 |
| 50% | 50.1% | 5,078,303 | 5,091,341 |
| 40% | 40.0% | 4,062,643 | 4,060,708 |
| 30% | 29.9% | 3,046,982 | 3,038,798 |
| 20% | 20.0% | 2,031,321 | 2,032,178 |
| 10% | 10.0% | 1,015,661 | 1,016,617 |
| Active Idle | 0 | 0 | |
| Set Identifier: | SUT |
| Set Description: | System Under Test |
| # of Identical Nodes: | 1 |
| Comment: | SUT |
| Hardware | |
|---|---|
| Hardware Vendor: | Hewlett Packard Enterprise |
| Model: | Superdome Flex 280 - 4 Socket |
| Form Factor: | 5U |
| CPU Name: | Intel Xeon Platinum 8380HL 2.90 GHz |
| CPU Characteristics: | 28-Core, 2.90 GHz, 38.5MB L3 Cache |
| CPU Frequency (MHz): | 2900 |
| CPU(s) Enabled: | 112 cores, 4 chips, 28 cores/chip |
| Hardware Threads: | 224 (2 / core) |
| CPU(s) Orderable: | 2,4 chips |
| Primary Cache: | 32 KB I + 32 KB D on chip per core |
| Secondary Cache: | 1 MB I+D on chip per core |
| Tertiary Cache: | 39424 KB I+D on chip per chip |
| Other Cache: | None |
| Memory Amount (GB): | 768 |
| # and size of DIMM: | 24 x 32768 MB |
| Memory Details: | 32GB 2Rx4 PC4-3200AA-RB2; 1 DIMM per channel slots populated |
| Power Supply Quantity and Rating (W): | 2 x 1600 |
| Power Supply Details: | HPE 1600W Platinum Power Supply (060-0415-002) |
| Disk Drive: | 1 x HPE Superdome Flex 280 480GB SATA 6G Mixed Use SFF (2.5in) BC 3yr Wty Digitally Signed Firmware SSD (R6A34) |
| Disk Controller: | Embedded SATA Controller |
| # and type of Network Interface Cards (NICs) Installed: | 1 x HPE Embedded Ethernet 1Gb 2-port adapter |
| NICs Enabled in Firmware / OS / Connected: | 2/2/1 |
| Network Speed (Mbit): | 1000 |
| Keyboard: | None |
| Mouse: | None |
| Monitor: | None |
| Optical Drives: | No |
| Other Hardware: | None |
| Software | |
|---|---|
| Power Management: | Enabled (see SUT Notes) |
| Operating System (OS): | SUSE Linux Enterprise Server 15 SP2 |
| OS Version: | 5.3.18-22-default |
| Filesystem: | xfs |
| JVM Vendor: | Oracle Corporation |
| JVM Version: | Oracle Java HotSpot(TM) 64-Bit Server VM 18.9 (build 11.0.8+10-LTS, mixed mode) |
| JVM Command-line Options: | -server -Xmn19g -Xms21g -Xmx21g -XX:SurvivorRatio=1 -XX:TargetSurvivorRatio=99 -XX:AllocatePrefetchDistance=384 -XX:AllocatePrefetchLines=4 -XX:LoopUnrollLimit=37 -XX:InitialTenuringThreshold=12 -XX:MaxTenuringThreshold=15 -XX:ParallelGCThreads=28 -XX:InlineSmallCode=3900 -XX:MaxInlineSize=270 -XX:FreqInlineSize=2500 -XX:+UseLargePages -XX:+UseParallelOldGC -XX:UseAVX=0 -XX:BiasedLockingStartupDelay=30000 -XX:-UseAdaptiveSizePolicy -XX:-ThreadLocalHandshakes |
| JVM Affinity: | numactl --cpunodebind=[0-7] --localalloc |
| JVM Instances: | 8 |
| JVM Initial Heap (MB): | 21000 |
| JVM Maximum Heap (MB): | 21000 |
| JVM Address Bits: | 64 |
| Boot Firmware Version: | 1.0.140 |
| Management Firmware Version: | 1.0.140 |
| Workload Version: | SSJ 1.2.10 |
| Director Location: | Controller |
| Other Software: | HPE Foundation Software 2 for SUSE Linux Enterprise Server Media License RTU |
| JVM Instance | ssj_ops@100% |
|---|---|
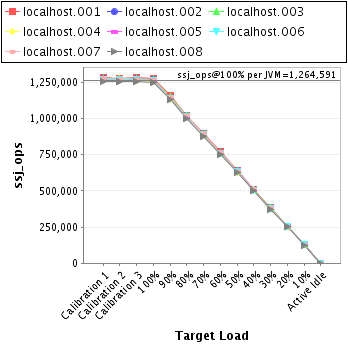
| localhost.001 | 1,277,524 |
| localhost.002 | 1,269,718 |
| localhost.003 | 1,270,898 |
| localhost.004 | 1,254,375 |
| localhost.005 | 1,263,750 |
| localhost.006 | 1,261,628 |
| localhost.007 | 1,269,442 |
| localhost.008 | 1,249,396 |
| ssj_ops@100% | 10,116,731 |
| ssj_ops@100% per JVM | 1,264,591 |
| Target Load | Actual Load | ssj_ops | |
|---|---|---|---|
| Target | Actual | ||
| Calibration 1 | 1,285,959 | ||
| Calibration 2 | 1,279,721 | ||
| Calibration 3 | 1,282,117 | ||
| ssj_ops@calibrated=1,280,919 | |||
| 100% | 99.7% | 1,280,919 | 1,277,524 |
| 90% | 90.3% | 1,152,827 | 1,156,122 |
| 80% | 79.7% | 1,024,735 | 1,021,422 |
| 70% | 70.1% | 896,643 | 897,862 |
| 60% | 60.1% | 768,551 | 770,240 |
| 50% | 50.0% | 640,459 | 640,744 |
| 40% | 40.0% | 512,368 | 512,287 |
| 30% | 30.1% | 384,276 | 386,006 |
| 20% | 19.9% | 256,184 | 254,399 |
| 10% | 9.9% | 128,092 | 127,381 |
| Active Idle | 0 | 0 | |

| Target Load | Actual Load | ssj_ops | |
|---|---|---|---|
| Target | Actual | ||
| Calibration 1 | 1,279,294 | ||
| Calibration 2 | 1,273,183 | ||
| Calibration 3 | 1,274,997 | ||
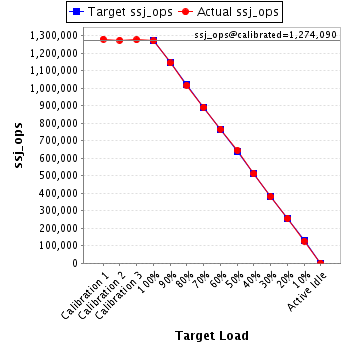
| ssj_ops@calibrated=1,274,090 | |||
| 100% | 99.7% | 1,274,090 | 1,269,718 |
| 90% | 89.7% | 1,146,681 | 1,143,455 |
| 80% | 79.8% | 1,019,272 | 1,016,208 |
| 70% | 69.9% | 891,863 | 890,434 |
| 60% | 60.1% | 764,454 | 765,884 |
| 50% | 50.5% | 637,045 | 643,640 |
| 40% | 40.1% | 509,636 | 510,592 |
| 30% | 29.9% | 382,227 | 380,534 |
| 20% | 20.0% | 254,818 | 255,237 |
| 10% | 9.9% | 127,409 | 126,710 |
| Active Idle | 0 | 0 | |
| Target Load | Actual Load | ssj_ops | |
|---|---|---|---|
| Target | Actual | ||
| Calibration 1 | 1,278,870 | ||
| Calibration 2 | 1,276,978 | ||
| Calibration 3 | 1,276,002 | ||
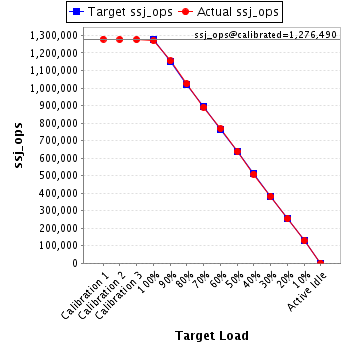
| ssj_ops@calibrated=1,276,490 | |||
| 100% | 99.6% | 1,276,490 | 1,270,898 |
| 90% | 90.5% | 1,148,841 | 1,154,621 |
| 80% | 80.2% | 1,021,192 | 1,024,127 |
| 70% | 69.8% | 893,543 | 891,355 |
| 60% | 60.2% | 765,894 | 767,963 |
| 50% | 50.0% | 638,245 | 637,644 |
| 40% | 39.8% | 510,596 | 508,452 |
| 30% | 30.0% | 382,947 | 382,428 |
| 20% | 19.9% | 255,298 | 253,786 |
| 10% | 10.1% | 127,649 | 129,123 |
| Active Idle | 0 | 0 | |
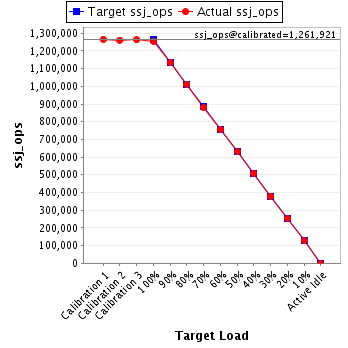
| Target Load | Actual Load | ssj_ops | |
|---|---|---|---|
| Target | Actual | ||
| Calibration 1 | 1,266,611 | ||
| Calibration 2 | 1,261,783 | ||
| Calibration 3 | 1,262,059 | ||
| ssj_ops@calibrated=1,261,921 | |||
| 100% | 99.4% | 1,261,921 | 1,254,375 |
| 90% | 89.8% | 1,135,729 | 1,133,123 |
| 80% | 80.1% | 1,009,537 | 1,010,915 |
| 70% | 69.9% | 883,345 | 882,439 |
| 60% | 59.9% | 757,153 | 756,437 |
| 50% | 50.0% | 630,960 | 630,635 |
| 40% | 40.1% | 504,768 | 506,410 |
| 30% | 29.9% | 378,576 | 377,881 |
| 20% | 20.1% | 252,384 | 254,106 |
| 10% | 10.0% | 126,192 | 126,527 |
| Active Idle | 0 | 0 | |
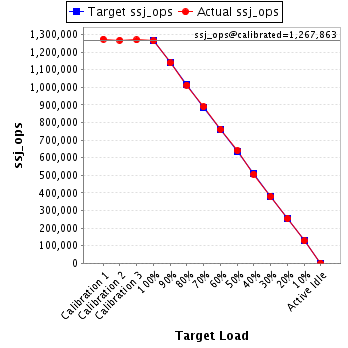
| Target Load | Actual Load | ssj_ops | |
|---|---|---|---|
| Target | Actual | ||
| Calibration 1 | 1,273,135 | ||
| Calibration 2 | 1,267,298 | ||
| Calibration 3 | 1,268,427 | ||
| ssj_ops@calibrated=1,267,863 | |||
| 100% | 99.7% | 1,267,863 | 1,263,750 |
| 90% | 89.8% | 1,141,077 | 1,138,733 |
| 80% | 79.9% | 1,014,290 | 1,012,657 |
| 70% | 70.1% | 887,504 | 889,398 |
| 60% | 60.0% | 760,718 | 760,425 |
| 50% | 50.4% | 633,931 | 639,428 |
| 40% | 39.9% | 507,145 | 506,340 |
| 30% | 29.9% | 380,359 | 378,556 |
| 20% | 20.0% | 253,573 | 253,264 |
| 10% | 10.1% | 126,786 | 127,605 |
| Active Idle | 0 | 0 | |
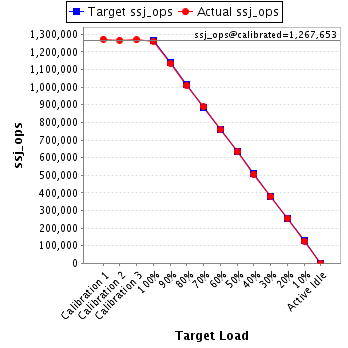
| Target Load | Actual Load | ssj_ops | |
|---|---|---|---|
| Target | Actual | ||
| Calibration 1 | 1,272,732 | ||
| Calibration 2 | 1,266,917 | ||
| Calibration 3 | 1,268,388 | ||
| ssj_ops@calibrated=1,267,653 | |||
| 100% | 99.5% | 1,267,653 | 1,261,628 |
| 90% | 89.6% | 1,140,887 | 1,135,421 |
| 80% | 79.8% | 1,014,122 | 1,011,504 |
| 70% | 70.1% | 887,357 | 888,702 |
| 60% | 59.9% | 760,592 | 759,294 |
| 50% | 49.9% | 633,826 | 632,514 |
| 40% | 39.9% | 507,061 | 506,150 |
| 30% | 29.9% | 380,296 | 378,549 |
| 20% | 20.2% | 253,531 | 256,204 |
| 10% | 10.0% | 126,765 | 126,257 |
| Active Idle | 0 | 0 | |
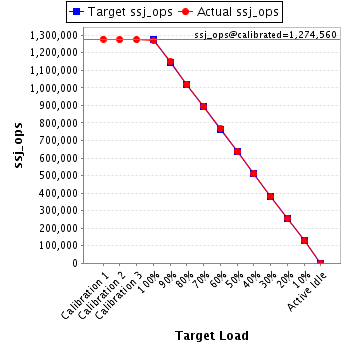
| Target Load | Actual Load | ssj_ops | |
|---|---|---|---|
| Target | Actual | ||
| Calibration 1 | 1,277,511 | ||
| Calibration 2 | 1,274,878 | ||
| Calibration 3 | 1,274,242 | ||
| ssj_ops@calibrated=1,274,560 | |||
| 100% | 99.6% | 1,274,560 | 1,269,442 |
| 90% | 90.1% | 1,147,104 | 1,148,055 |
| 80% | 80.1% | 1,019,648 | 1,020,627 |
| 70% | 70.0% | 892,192 | 892,687 |
| 60% | 60.2% | 764,736 | 767,361 |
| 50% | 50.0% | 637,280 | 637,845 |
| 40% | 40.1% | 509,824 | 510,782 |
| 30% | 29.9% | 382,368 | 381,001 |
| 20% | 19.9% | 254,912 | 253,982 |
| 10% | 10.0% | 127,456 | 127,135 |
| Active Idle | 0 | 0 | |
| Target Load | Actual Load | ssj_ops | |
|---|---|---|---|
| Target | Actual | ||
| Calibration 1 | 1,257,806 | ||
| Calibration 2 | 1,253,108 | ||
| Calibration 3 | 1,253,114 | ||
| ssj_ops@calibrated=1,253,111 | |||
| 100% | 99.7% | 1,253,111 | 1,249,396 |
| 90% | 90.1% | 1,127,800 | 1,128,991 |
| 80% | 79.7% | 1,002,489 | 998,891 |
| 70% | 70.1% | 877,178 | 878,741 |
| 60% | 59.8% | 751,867 | 749,620 |
| 50% | 50.2% | 626,556 | 628,892 |
| 40% | 39.9% | 501,244 | 499,696 |
| 30% | 29.8% | 375,933 | 373,842 |
| 20% | 20.0% | 250,622 | 251,201 |
| 10% | 10.0% | 125,311 | 125,878 |
| Active Idle | 0 | 0 | |
