| Target Load |
Actual Load |
ssj_ops |
| Target |
Actual |
| Calibration 1 |
|
|
2,807,226 |
| Calibration 2 |
|
|
3,288,380 |
| Calibration 3 |
|
|
3,286,113 |
| ssj_ops@calibrated=3,287,247 |
| 100% |
99.5% |
3,287,247 |
3,269,735 |
| 90% |
89.8% |
2,958,522 |
2,952,754 |
| 80% |
80.5% |
2,629,797 |
2,646,240 |
| 70% |
70.3% |
2,301,073 |
2,310,987 |
| 60% |
60.0% |
1,972,348 |
1,972,933 |
| 50% |
50.0% |
1,643,623 |
1,642,065 |
| 40% |
40.0% |
1,314,899 |
1,315,144 |
| 30% |
30.0% |
986,174 |
984,697 |
| 20% |
20.0% |
657,449 |
656,493 |
| 10% |
10.1% |
328,725 |
330,914 |
| Active Idle |
|
0 |
0 |
| Hardware |
| Hardware Vendor: |
Hewlett Packard Enterprise |
| Model: |
ProLiant DL110 Gen10 Plus |
| Form Factor: |
1U |
| CPU Name: |
Intel Xeon Gold 6314U CPU @ 2.30GHz (Intel Turbo Boost Technology up to 3.4GHz) |
| CPU Characteristics: |
32-Core, 2.30 GHz, 48MB L3 Cache |
| CPU Frequency (MHz): |
2300 |
| CPU(s) Enabled: |
32 cores, 1 chip, 32 cores/chip |
| Hardware Threads: |
64 (2 / core) |
| CPU(s) Orderable: |
1 chip |
| Primary Cache: |
32 KB I + 32 KB D on chip per core |
| Secondary Cache: |
1280 KB I+D on chip per core |
| Tertiary Cache: |
48 MB I+D on chip per chip |
| Other Cache: |
None |
| Memory Amount (GB): |
64 |
| # and size of DIMM: |
8 x 8192 MB |
| Memory Details: |
8 x 8GB 1Rx8 PC4-3200-AA-RD1-12; slots 1,2,3,4,5,6,7,8 populated in each socket |
| Power Supply Quantity and Rating (W): |
1 x 700 |
| Power Supply Details: |
HPE 700W Flex Slot Platinum Hot Plug Low Halogen AC Power Supply Kit (P44975-B21) |
| Disk Drive: |
1 x HPE 240GB SATA 6G M.2 5300 SSD (P19888-B21) |
| Disk Controller: |
Embedded SATA Controller |
| # and type of Network Interface Cards (NICs) Installed: |
1 x Ethernet 10/25Gb 2-port SFP28 MCX562A-ACAI OCP3 Adapter |
| NICs Enabled in Firmware / OS / Connected: |
2/2/1 |
| Network Speed (Mbit): |
1000 |
| Keyboard: |
None |
| Mouse: |
None |
| Monitor: |
None |
| Optical Drives: |
No |
| Other Hardware: |
None |
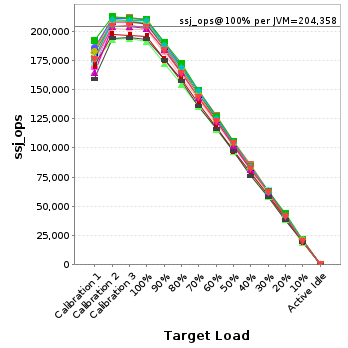
| JVM Instance |
ssj_ops@100% |
| localhost.001 |
210,413 |
| localhost.002 |
209,779 |
| localhost.003 |
191,256 |
| localhost.004 |
206,585 |
| localhost.005 |
206,372 |
| localhost.006 |
208,826 |
| localhost.007 |
201,310 |
| localhost.008 |
205,452 |
| localhost.009 |
195,658 |
| localhost.010 |
207,011 |
| localhost.011 |
210,529 |
| localhost.012 |
207,669 |
| localhost.013 |
202,675 |
| localhost.014 |
209,223 |
| localhost.015 |
193,422 |
| localhost.016 |
203,555 |
| ssj_ops@100% |
3,269,735 |
| ssj_ops@100% per JVM |
204,358 |
JVM 'localhost.001' Scores:
| Target Load |
Actual Load |
ssj_ops |
| Target |
Actual |
| Calibration 1 |
|
|
183,790 |
| Calibration 2 |
|
|
211,738 |
| Calibration 3 |
|
|
211,805 |
| ssj_ops@calibrated=211,772 |
| 100% |
99.4% |
211,772 |
210,413 |
| 90% |
90.1% |
190,594 |
190,726 |
| 80% |
80.3% |
169,417 |
170,124 |
| 70% |
70.7% |
148,240 |
149,695 |
| 60% |
60.5% |
127,063 |
128,027 |
| 50% |
49.7% |
105,886 |
105,314 |
| 40% |
40.4% |
84,709 |
85,590 |
| 30% |
29.7% |
63,531 |
62,984 |
| 20% |
19.6% |
42,354 |
41,564 |
| 10% |
9.9% |
21,177 |
21,039 |
| Active Idle |
|
0 |
0 |
JVM 'localhost.002' Scores:
| Target Load |
Actual Load |
ssj_ops |
| Target |
Actual |
| Calibration 1 |
|
|
186,182 |
| Calibration 2 |
|
|
210,696 |
| Calibration 3 |
|
|
210,972 |
| ssj_ops@calibrated=210,834 |
| 100% |
99.5% |
210,834 |
209,779 |
| 90% |
89.5% |
189,750 |
188,612 |
| 80% |
80.9% |
168,667 |
170,534 |
| 70% |
70.4% |
147,584 |
148,502 |
| 60% |
60.0% |
126,500 |
126,483 |
| 50% |
49.5% |
105,417 |
104,366 |
| 40% |
39.5% |
84,334 |
83,327 |
| 30% |
29.8% |
63,250 |
62,761 |
| 20% |
20.1% |
42,167 |
42,442 |
| 10% |
10.0% |
21,083 |
21,051 |
| Active Idle |
|
0 |
0 |
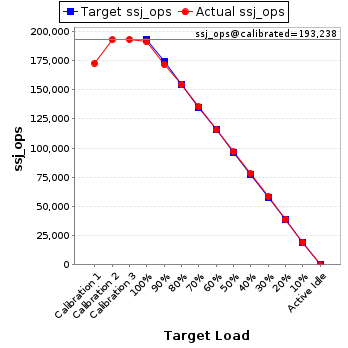
JVM 'localhost.003' Scores:
| Target Load |
Actual Load |
ssj_ops |
| Target |
Actual |
| Calibration 1 |
|
|
172,876 |
| Calibration 2 |
|
|
193,036 |
| Calibration 3 |
|
|
193,441 |
| ssj_ops@calibrated=193,238 |
| 100% |
99.0% |
193,238 |
191,256 |
| 90% |
89.1% |
173,915 |
172,091 |
| 80% |
80.1% |
154,591 |
154,728 |
| 70% |
70.1% |
135,267 |
135,512 |
| 60% |
60.1% |
115,943 |
116,154 |
| 50% |
50.2% |
96,619 |
97,083 |
| 40% |
40.4% |
77,295 |
78,134 |
| 30% |
30.3% |
57,972 |
58,634 |
| 20% |
20.2% |
38,648 |
38,988 |
| 10% |
10.0% |
19,324 |
19,252 |
| Active Idle |
|
0 |
0 |
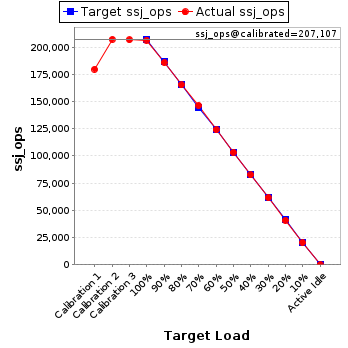
JVM 'localhost.004' Scores:
| Target Load |
Actual Load |
ssj_ops |
| Target |
Actual |
| Calibration 1 |
|
|
179,943 |
| Calibration 2 |
|
|
207,328 |
| Calibration 3 |
|
|
206,885 |
| ssj_ops@calibrated=207,107 |
| 100% |
99.7% |
207,107 |
206,585 |
| 90% |
89.8% |
186,396 |
186,016 |
| 80% |
79.8% |
165,685 |
165,301 |
| 70% |
70.8% |
144,975 |
146,616 |
| 60% |
60.0% |
124,264 |
124,229 |
| 50% |
50.0% |
103,553 |
103,560 |
| 40% |
39.8% |
82,843 |
82,485 |
| 30% |
29.9% |
62,132 |
61,823 |
| 20% |
19.8% |
41,421 |
40,960 |
| 10% |
9.9% |
20,711 |
20,543 |
| Active Idle |
|
0 |
0 |
JVM 'localhost.005' Scores:
| Target Load |
Actual Load |
ssj_ops |
| Target |
Actual |
| Calibration 1 |
|
|
168,692 |
| Calibration 2 |
|
|
207,864 |
| Calibration 3 |
|
|
207,226 |
| ssj_ops@calibrated=207,545 |
| 100% |
99.4% |
207,545 |
206,372 |
| 90% |
89.9% |
186,790 |
186,547 |
| 80% |
81.0% |
166,036 |
168,030 |
| 70% |
70.3% |
145,281 |
145,870 |
| 60% |
60.2% |
124,527 |
124,890 |
| 50% |
50.0% |
103,772 |
103,748 |
| 40% |
40.3% |
83,018 |
83,648 |
| 30% |
29.8% |
62,263 |
61,899 |
| 20% |
20.1% |
41,509 |
41,615 |
| 10% |
10.1% |
20,754 |
21,055 |
| Active Idle |
|
0 |
0 |
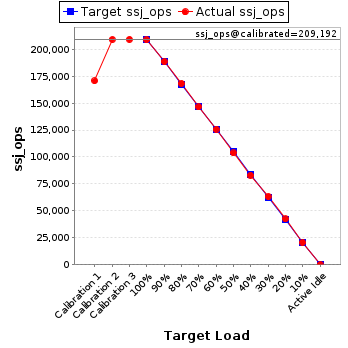
JVM 'localhost.006' Scores:
| Target Load |
Actual Load |
ssj_ops |
| Target |
Actual |
| Calibration 1 |
|
|
170,641 |
| Calibration 2 |
|
|
209,118 |
| Calibration 3 |
|
|
209,266 |
| ssj_ops@calibrated=209,192 |
| 100% |
99.8% |
209,192 |
208,826 |
| 90% |
90.2% |
188,273 |
188,606 |
| 80% |
80.5% |
167,353 |
168,411 |
| 70% |
70.0% |
146,434 |
146,462 |
| 60% |
60.2% |
125,515 |
125,849 |
| 50% |
49.6% |
104,596 |
103,692 |
| 40% |
39.7% |
83,677 |
83,004 |
| 30% |
30.3% |
62,758 |
63,392 |
| 20% |
20.3% |
41,838 |
42,441 |
| 10% |
10.0% |
20,919 |
20,837 |
| Active Idle |
|
0 |
0 |
JVM 'localhost.007' Scores:
| Target Load |
Actual Load |
ssj_ops |
| Target |
Actual |
| Calibration 1 |
|
|
163,767 |
| Calibration 2 |
|
|
202,166 |
| Calibration 3 |
|
|
201,391 |
| ssj_ops@calibrated=201,778 |
| 100% |
99.8% |
201,778 |
201,310 |
| 90% |
89.9% |
181,601 |
181,421 |
| 80% |
79.7% |
161,423 |
160,786 |
| 70% |
70.2% |
141,245 |
141,695 |
| 60% |
59.9% |
121,067 |
120,853 |
| 50% |
50.2% |
100,889 |
101,270 |
| 40% |
40.2% |
80,711 |
81,156 |
| 30% |
30.1% |
60,534 |
60,744 |
| 20% |
19.9% |
40,356 |
40,239 |
| 10% |
10.0% |
20,178 |
20,187 |
| Active Idle |
|
0 |
0 |
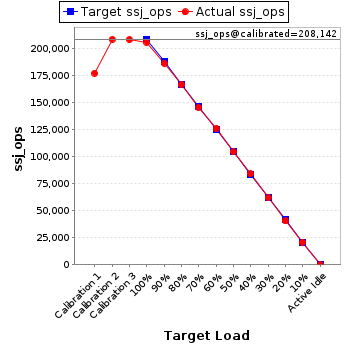
JVM 'localhost.008' Scores:
| Target Load |
Actual Load |
ssj_ops |
| Target |
Actual |
| Calibration 1 |
|
|
176,939 |
| Calibration 2 |
|
|
208,177 |
| Calibration 3 |
|
|
208,108 |
| ssj_ops@calibrated=208,142 |
| 100% |
98.7% |
208,142 |
205,452 |
| 90% |
89.4% |
187,328 |
186,167 |
| 80% |
80.0% |
166,514 |
166,485 |
| 70% |
69.9% |
145,700 |
145,517 |
| 60% |
60.6% |
124,885 |
126,109 |
| 50% |
50.0% |
104,071 |
104,130 |
| 40% |
40.3% |
83,257 |
83,817 |
| 30% |
29.8% |
62,443 |
62,060 |
| 20% |
19.4% |
41,628 |
40,344 |
| 10% |
10.0% |
20,814 |
20,887 |
| Active Idle |
|
0 |
0 |
JVM 'localhost.009' Scores:
| Target Load |
Actual Load |
ssj_ops |
| Target |
Actual |
| Calibration 1 |
|
|
170,464 |
| Calibration 2 |
|
|
196,967 |
| Calibration 3 |
|
|
196,842 |
| ssj_ops@calibrated=196,905 |
| 100% |
99.4% |
196,905 |
195,658 |
| 90% |
89.3% |
177,214 |
175,854 |
| 80% |
80.4% |
157,524 |
158,292 |
| 70% |
70.0% |
137,833 |
137,842 |
| 60% |
59.9% |
118,143 |
117,958 |
| 50% |
49.8% |
98,452 |
98,150 |
| 40% |
39.9% |
78,762 |
78,595 |
| 30% |
30.2% |
59,071 |
59,539 |
| 20% |
19.9% |
39,381 |
39,166 |
| 10% |
10.0% |
19,690 |
19,688 |
| Active Idle |
|
0 |
0 |
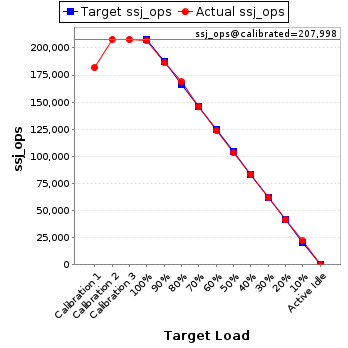
JVM 'localhost.010' Scores:
| Target Load |
Actual Load |
ssj_ops |
| Target |
Actual |
| Calibration 1 |
|
|
181,974 |
| Calibration 2 |
|
|
207,999 |
| Calibration 3 |
|
|
207,997 |
| ssj_ops@calibrated=207,998 |
| 100% |
99.5% |
207,998 |
207,011 |
| 90% |
89.8% |
187,198 |
186,747 |
| 80% |
81.1% |
166,398 |
168,674 |
| 70% |
70.3% |
145,599 |
146,270 |
| 60% |
59.6% |
124,799 |
124,020 |
| 50% |
49.8% |
103,999 |
103,519 |
| 40% |
40.2% |
83,199 |
83,572 |
| 30% |
30.0% |
62,399 |
62,366 |
| 20% |
19.9% |
41,600 |
41,301 |
| 10% |
10.5% |
20,800 |
21,902 |
| Active Idle |
|
0 |
0 |
JVM 'localhost.011' Scores:
| Target Load |
Actual Load |
ssj_ops |
| Target |
Actual |
| Calibration 1 |
|
|
191,959 |
| Calibration 2 |
|
|
212,783 |
| Calibration 3 |
|
|
211,422 |
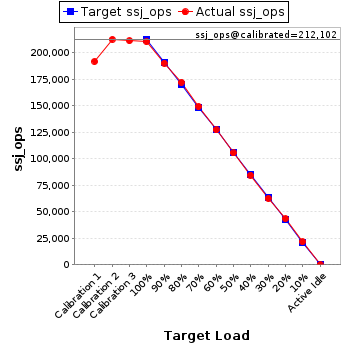
| ssj_ops@calibrated=212,102 |
| 100% |
99.3% |
212,102 |
210,529 |
| 90% |
89.7% |
190,892 |
190,308 |
| 80% |
81.2% |
169,682 |
172,279 |
| 70% |
70.5% |
148,472 |
149,458 |
| 60% |
60.0% |
127,261 |
127,297 |
| 50% |
49.7% |
106,051 |
105,438 |
| 40% |
39.8% |
84,841 |
84,511 |
| 30% |
29.6% |
63,631 |
62,749 |
| 20% |
20.6% |
42,420 |
43,589 |
| 10% |
10.2% |
21,210 |
21,604 |
| Active Idle |
|
0 |
0 |
JVM 'localhost.012' Scores:
| Target Load |
Actual Load |
ssj_ops |
| Target |
Actual |
| Calibration 1 |
|
|
183,009 |
| Calibration 2 |
|
|
208,022 |
| Calibration 3 |
|
|
208,159 |
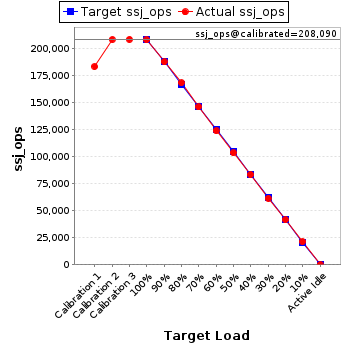
| ssj_ops@calibrated=208,090 |
| 100% |
99.8% |
208,090 |
207,669 |
| 90% |
90.1% |
187,281 |
187,386 |
| 80% |
80.7% |
166,472 |
167,964 |
| 70% |
70.0% |
145,663 |
145,719 |
| 60% |
59.4% |
124,854 |
123,613 |
| 50% |
49.7% |
104,045 |
103,318 |
| 40% |
40.0% |
83,236 |
83,208 |
| 30% |
29.5% |
62,427 |
61,463 |
| 20% |
20.0% |
41,618 |
41,535 |
| 10% |
10.2% |
20,809 |
21,250 |
| Active Idle |
|
0 |
0 |
JVM 'localhost.013' Scores:
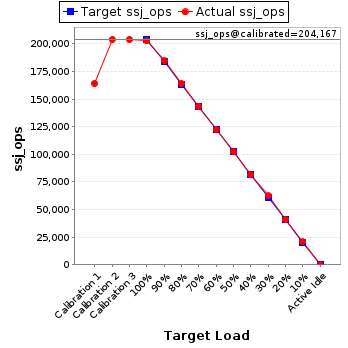
| Target Load |
Actual Load |
ssj_ops |
| Target |
Actual |
| Calibration 1 |
|
|
164,314 |
| Calibration 2 |
|
|
204,231 |
| Calibration 3 |
|
|
204,104 |
| ssj_ops@calibrated=204,167 |
| 100% |
99.3% |
204,167 |
202,675 |
| 90% |
90.5% |
183,750 |
184,797 |
| 80% |
80.5% |
163,334 |
164,371 |
| 70% |
70.3% |
142,917 |
143,628 |
| 60% |
60.1% |
122,500 |
122,729 |
| 50% |
50.1% |
102,084 |
102,215 |
| 40% |
39.9% |
81,667 |
81,534 |
| 30% |
30.6% |
61,250 |
62,410 |
| 20% |
20.1% |
40,833 |
41,049 |
| 10% |
10.1% |
20,417 |
20,574 |
| Active Idle |
|
0 |
0 |
JVM 'localhost.014' Scores:
| Target Load |
Actual Load |
ssj_ops |
| Target |
Actual |
| Calibration 1 |
|
|
177,043 |
| Calibration 2 |
|
|
209,758 |
| Calibration 3 |
|
|
209,198 |
| ssj_ops@calibrated=209,478 |
| 100% |
99.9% |
209,478 |
209,223 |
| 90% |
89.9% |
188,530 |
188,260 |
| 80% |
80.7% |
167,582 |
169,022 |
| 70% |
71.1% |
146,635 |
148,914 |
| 60% |
60.0% |
125,687 |
125,604 |
| 50% |
50.2% |
104,739 |
105,104 |
| 40% |
40.1% |
83,791 |
83,979 |
| 30% |
29.6% |
62,843 |
62,088 |
| 20% |
20.1% |
41,896 |
42,105 |
| 10% |
10.1% |
20,948 |
21,070 |
| Active Idle |
|
0 |
0 |
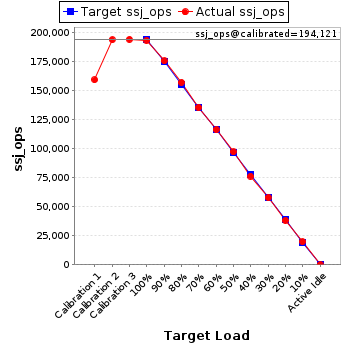
JVM 'localhost.015' Scores:
| Target Load |
Actual Load |
ssj_ops |
| Target |
Actual |
| Calibration 1 |
|
|
159,383 |
| Calibration 2 |
|
|
193,933 |
| Calibration 3 |
|
|
194,309 |
| ssj_ops@calibrated=194,121 |
| 100% |
99.6% |
194,121 |
193,422 |
| 90% |
90.5% |
174,709 |
175,692 |
| 80% |
81.0% |
155,297 |
157,279 |
| 70% |
69.8% |
135,885 |
135,587 |
| 60% |
60.0% |
116,473 |
116,526 |
| 50% |
50.1% |
97,061 |
97,249 |
| 40% |
39.3% |
77,649 |
76,340 |
| 30% |
29.9% |
58,236 |
57,961 |
| 20% |
19.7% |
38,824 |
38,274 |
| 10% |
10.2% |
19,412 |
19,800 |
| Active Idle |
|
0 |
0 |
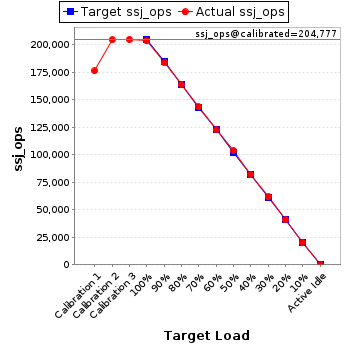
JVM 'localhost.016' Scores:
| Target Load |
Actual Load |
ssj_ops |
| Target |
Actual |
| Calibration 1 |
|
|
176,253 |
| Calibration 2 |
|
|
204,564 |
| Calibration 3 |
|
|
204,990 |
| ssj_ops@calibrated=204,777 |
| 100% |
99.4% |
204,777 |
203,555 |
| 90% |
89.6% |
184,299 |
183,524 |
| 80% |
80.1% |
163,822 |
163,959 |
| 70% |
70.2% |
143,344 |
143,700 |
| 60% |
59.9% |
122,866 |
122,595 |
| 50% |
50.7% |
102,388 |
103,910 |
| 40% |
40.2% |
81,911 |
82,244 |
| 30% |
30.2% |
61,433 |
61,825 |
| 20% |
20.0% |
40,955 |
40,880 |
| 10% |
9.9% |
20,478 |
20,172 |
| Active Idle |
|
0 |
0 |