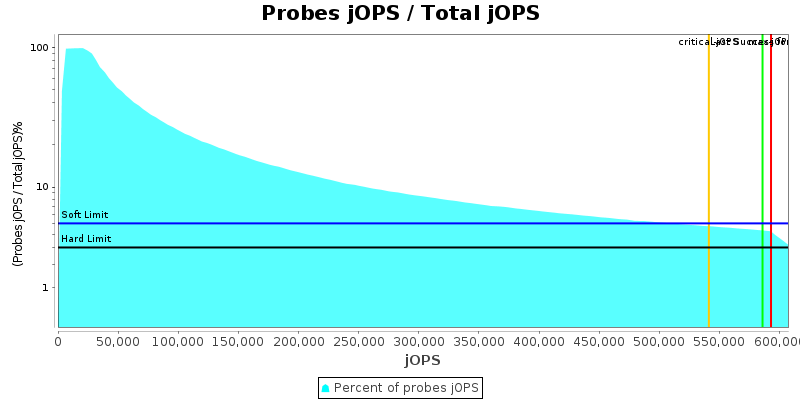
Hewlett Packard Enterprise ProLiant DL385 Gen11 592949 SPECjbb2015-Composite max-jOPS
541247 SPECjbb2015-Composite critical-jOPS
Tested by: Hewlett Packard Enterprise Test Sponsor: Hewlett Packard Enterprise Test location: Houston, TX Test date: October 17, 2022
SPEC license #: 3 Hardware Availability: Nov-2022 Software Availability: Aug-2022 Publication: Thu Nov 10 10:29:34 EST 2022
Benchmark Results Summary
 
Overall Throughput RT curve
Overall SUT (System Under Test) Description
VendorHewlett Packard Enterprise
Vendor URLhttp://www.hpe.com/
System SourceSingle Supplier
System DesignationServer Rack
Total Systems1
All SUT Systems IdenticalYES
Total Nodes1
All Nodes IdenticalYES
Nodes Per System1
Total Chips2
Total Cores192
Total Threads384
Total Memory Amount (GB)1536
Total OS Images1
SW EnvironmentNon-virtual
 
Hardware hw_1
NameProLiant DL385 Gen11
VendorHewlett Packard Enterprise
Vendor URLhttp://hpe.com/
AvailableNov-2022
ModelProLiant DL385 Gen11
Form Factor2U Rack
CPU NameAMD EPYC 9654
CPU Characteristics96 Core, 2.4 GHz, 384 MB L3 Cache(Max. Boost Clock Up to 3.7 GHz)
Number of Systems1
Nodes Per System1
Chips Per System2
Cores Per System192
Cores Per Chip96
Threads Per System384
Threads Per Core2
VersionA55 v1.10 10/14/2022
CPU Frequency (MHz)2400
Primary Cache32 KB I + 32 KB D on chip per core
Secondary Cache1024 KB I+D on chip per core
Tertiary Cache384 MB (I+D) on chip per chip
Other CacheNone
Disk1 x 3.2 TB NVMe SSD
File SystemXFS
Memory Amount (GB)1536
# and size of DIMM(s)24 x 64 GB
Memory Details64GB 2Rx4 PC5-38400R , running at 4800 MHz
# and type of Network Interface Cards (NICs)HPE Ethernet 10Gb 2-port
Power Supply Quantity and Rating (W)2 x 1600
Other HardwareNone
Cabinet/Housing/EnclosureNone
Shared DescriptionNone
Shared CommentNone
Notes
  • NA: The test sponsor attests, as of date of publication, that CVE-2017-5754 (Meltdown) is mitigated in the system as tested and documented.
  • Yes: The test sponsor attests, as of date of publication, that CVE-2017-5753 (Spectre variant 1) is mitigated in the system as tested and documented.
  • Yes: The test sponsor attests, as of date of publication, that CVE-2017-5715 (Spectre variant 2) is mitigated in the system as tested and documented.
  • Cabled the 4th xGMI (xGMI3)
Other Hardware network_1
NameNone
VendorNone
Vendor URLNone
VersionNone
AvailableNone
BitnessNone
NotesNone
Operating System os_1
NameSUSE Linux Enterprise Server 15 SP4
VendorSUSE
Vendor URLhttp://suse.com/
Version5.14.21-150400.22-default
AvailableJul-2022
Bitness64
NotesNone
Java Virtual Machine jvm_1
NameOracle Java SE 18.0.2.1
VendorOracle
Vendor URLhttp://www.oracle.com
VersionJava HotSpot 64-bit Server VM, version 18.0.2.1
AvailableAug-2022
Bitness64
NotesNone
Other Software other_1
NameNone
VendorNone
Vendor URLNone
VersionNone
AvailableNone
BitnessNone
NotesNone
Hardware
OS Images os_Image_1(1)
Hardware Description hw_1
Number of Systems 1
SW Environment non-virtual
Tuning
  • Workload Profile=High Performance Compute(HPC)
  • Thermal Configuration=Maximum Cooling
  • Determinism Control=Manual
  • Performance Determinism=Power Deterministic
  • Memory Patrol Scrubbing=Disabled
  • Numa Memory Domains Per Socket(NPS)=Two Memory Domains Per Socket
  • Last-Level Cache(LLC) As NUMA Node=Disabled
  • L1 Stream HW Prefetcher=Disabled
  • L2 Stream HW Prefetcher=Disabled
  • Minimum Processor Idle Power Core C-State=No-States
  • xGMI Link Bandwidth=32Gbps
  • Package Power Limit=400
Notes None
OS Image os_Image_1
JVM Instances jvm_Composite_1(1)
OS Image Description os_1
Tuning
  • ulimit -n 1024000
  • UserTasksMax=970000
  • DefaultTasksMax=970000
  • tuned-adm profile throughput-performance
  • write_schedstat rt_runtime_us 950000
  • write_schedstat latency_ns 20000000
  • write_schedstat migration_cost_ns 40000
  • write_schedstat min_granularity_ns 200000
  • write_schedstat wakeup_granularity_ns 40000
  • write_schedstat nr_migrate 128
  • echo 10000 > /proc/sys/vm/dirty_expire_centisecs
  • echo 1500 > /proc/sys/vm/dirty_writeback_centisecs
  • echo 40 > /proc/sys/vm/dirty_ratio
  • echo 10 > /proc/sys/vm/dirty_background_ratio
  • echo 10 > /proc/sys/vm/swappiness
  • echo 1 > /proc/sys/kernel/numa_balancing
  • echo always > /sys/kernel/mm/transparent_hugepage/defrag
  • echo always > /sys/kernel/mm/transparent_hugepage/enabled
Notes None
JVM Instance jvm_Composite_1
Parts of Benchmark Composite
JVM Instance Description jvm_1
Command Line

-Xms1455g -Xmx1455g -Xmn1440g -server -XX:+UseParallelGC -XX:+AlwaysPreTouch -XX:+UseLargePages -XX:LargePageSizeInBytes=2m -XX:MaxTenuringThreshold=5 -XX:-UseAdaptiveSizePolicy -XX:ParallelGCThreads=384 -XX:SurvivorRatio=84 -XX:TargetSurvivorRatio=95 -XX:+UseNUMA -XX:-UseAdaptiveNUMAChunkSizing -XX:+UseTransparentHugePages -XX:InlineSmallCode=11k -XX:TLABAllocationWeight=2 -XX:ThreadStackSize=140 -XX:AutoBoxCacheMax=32

Tuning

Used numactl to bind the JVM to all NUMA nodes available on the SUT

  • numactl --cpunodebind=0-3 --interleave=0-3
Notes None
max-jOPS = jOPS passed before the First Failure
Pass/Fail Pass Pass Pass Fail Fail
jOPS 578831 585890 592949 600008 607067
critical-jOPS = Geomean ( jOPS @ 10000; 25000; 50000; 75000; 100000; SLAs )
Response time percentile is 99-th
SLA (us) 10000 25000 50000 75000 100000 Geomean
jOPS 435300 547066 568243 582360 589419 541247
  Percentile
  10-th 50-th 90-th 95-th 99-th 100-th
500us 204709 / 211768 7059 / 14118 - / 7059 - / 7059 - / 7059 - / 7059
1000us 529419 / 536478 247062 / 254121 63530 / 70589 42354 / 49412 21177 / 28236 - / 7059
5000us 592949 / - 578831 / 585890 444712 / 451771 352946 / 360005 218827 / 225885 84707 / 35295
10000us 592949 / - 585890 / 592949 564714 / 571773 536478 / 543537 444712 / 430594 84707 / 35295
25000us 592949 / - 592949 / - 585890 / 592949 578831 / 585890 543537 / 550596 155296 / 35295
50000us 592949 / - 592949 / - 592949 / - 592949 / - 564714 / 571773 211768 / 35295
75000us 592949 / - 592949 / - 592949 / - 592949 / - 578831 / 585890 211768 / 35295
100000us 592949 / - 592949 / - 592949 / - 592949 / - 585890 / 592949 317651 / 77648
200000us 592949 / - 592949 / - 592949 / - 592949 / - 592949 / - 480007 / 451771
500000us 592949 / - 592949 / - 592949 / - 592949 / - 592949 / - 564714 / 571773
1000000us 592949 / - 592949 / - 592949 / - 592949 / - 592949 / - 578831 / 585890
Probes jOPS / Total jOPS
Request Mix Accuracy
Note
(Actual % in the Mix - Expected % in the Mix) must be within:
'Main Tx' limit of +/-5.0% for the requests whose expected % in the mix is >= 10.0%
'Minor Tx' limit of +/-1.0% for the requests whose expected % in the mix is < 10.0%
There were no non-critical failures in Response Time curve building
Delay between status pings
IR/PR Accuracy
This section lists properties only set by user
Property Name Default Controller
specjbb.comm.connect.selector.runner.count 0 1
specjbb.controller.maxir.maxFailedPoints 3 1
specjbb.controller.rtcurve.warmup.step 0.1 0.2
specjbb.customerDriver.threads 64 {probe=64, saturate=128}
specjbb.forkjoin.workers 384 {Tier1=92, Tier2=1, Tier3=16}
specjbb.group.count 1 4
specjbb.heartbeat.period 10000 50000
specjbb.heartbeat.threshold 100000 500000
specjbb.mapreducer.pool.size 384 2
View table in csv format
 
Level: COMPLIANCE
Check Agent Result
Check properties on compliance All PASSED
 
Level: CORRECTNESS
Check Agent Result
Compare SM and HQ Inventory All PASSED
High-bound (max attempted) is 705892 IR
High-bound (settled) is 635095 IR