
SPECpower_ssj2008
Host '0001' Performance Report
Copyright © 2007 Standard Performance Evaluation Corporation
| Hewlett-Packard Company Proliant DL580 G5 (1.86 GHz, Intel Xeon processor L7345) | ssj_ops@100% = 359,523 ssj_ops@100% per JVM = 89,881 |
||||
| Test Sponsor: | Hewlett-Packard Company | SPEC License #: | 3 | Test Method: | Single Node |
| Tested By: | Hewlett-Packard Company | Test Location: | Houston, TX, USA | Test Date: | Dec 6, 2007 |
| Hardware Availability: | Jan-2008 | Software Availability: | Dec-2007 | Publication: | Dec 11, 2007 |
| System Source: | Single Supplier | System Designation: | Server | Power Provisioning: | Line-powered |
| Target Load | Actual Load | ssj_ops | |
|---|---|---|---|
| Target | Actual | ||
| Calibration 1 | 366,470 | ||
| Calibration 2 | 363,082 | ||
| Calibration 3 | 361,741 | ||
| ssj_ops@calibrated=362,412 | |||
| 100% | 99.2% | 362,412 | 359,523 |
| 90% | 89.9% | 326,170 | 325,931 |
| 80% | 80.6% | 289,929 | 291,991 |
| 70% | 70.5% | 253,688 | 255,512 |
| 60% | 59.9% | 217,447 | 217,222 |
| 50% | 49.7% | 181,206 | 180,262 |
| 40% | 40.0% | 144,965 | 145,079 |
| 30% | 30.4% | 108,723 | 110,173 |
| 20% | 19.7% | 72,482 | 71,409 |
| 10% | 10.0% | 36,241 | 36,070 |
| Active Idle | 0 | 0 | |

| Set Identifier: | sut |
| Set Description: | Proliant DL580 G5 (1.86 GHz, Intel Xeon processor L7345) |
| # of Identical Nodes: | 1 |
| Comment: | None |
| Hardware | |
|---|---|
| Hardware Vendor: | Hewlett-Packard Company |
| Model: | Proliant DL580 G5 (1.86 GHz, Intel Xeon processor L7345) |
| Form Factor: | -- |
| CPU Name: | Intel Xeon L7345 |
| CPU Characteristics: | 1.86 GHz, 2x4 MB L2 shared, 1066 MHz system bus |
| CPU Frequency (MHz): | 1860 |
| CPU(s) Enabled: | 16 cores, 4 chips, 4 cores/chip |
| Hardware Threads: | 16 (1 / core) |
| CPU(s) Orderable: | 2,4 chips |
| Primary Cache: | 32 KB I + 32 KB D on chip per core |
| Secondary Cache: | 8 MB I+D on chip per chip, 4 MB shared / 2 cores |
| Tertiary Cache: | None |
| Other Cache: | None |
| Memory Amount (GB): | 16 |
| # and size of DIMM: | 4 x 4096 MB |
| Memory Details: | PC2-5300F CL5 LP; slots 1,5,9,13 populated |
| Power Supply Quantity and Rating (W): | 2 x 1200 |
| Power Supply Details: | HP part # 437572-B21 |
| Disk Drive: | 1 x 60GB HP, 1.5G, 5.4K, 2.5" SFF SATA HDD |
| Disk Controller: | HP Smart Array P400 with 512 MB battery backed write cache |
| # and type of Network Interface Cards (NICs) Installed: | 2 x NC373i |
| NICs Enabled in Firmware / OS / Connected: | 2/1/1 |
| Network Speed (Mbit): | 1000 |
| Keyboard: | KVM |
| Mouse: | KVM |
| Monitor: | KVM |
| Optical Drives: | Yes |
| Other Hardware: | None |
| Software | |
|---|---|
| Power Management: | HP Dynamic Power Regulator enabled |
| Operating System (OS): | Microsoft Windows Server 2003 x64 Enterprise Edition |
| OS Version: | R2 |
| Filesystem: | NTFS |
| JVM Vendor: | BEA Systems, Inc. |
| JVM Version: | BEA JRockit(R) (build P27.4.0-10-90053-1.6.0_02-20071009-1827-windows-x86_64, compiled mode) |
| JVM Command-line Options: | -Xms3600m -Xmx3600m -Xns3100m -XXaggressive -XXlargePages -XXthroughputCompaction -XXcallprofiling -XXlazyUnlocking -Xgc:genpar -XXgcthreads:2 -XXtlasize:min=12k,preferred=1024k |
| JVM Affinity: | Used "start /affinity" with "0xf", "0xf0", "0xf00" and "0xf000" CPU masks |
| JVM Instances: | 8 |
| JVM Initial Heap (MB): | 3600 |
| JVM Maximum Heap (MB): | 3600 |
| JVM Address Bits: | 64 |
| Boot Firmware Version: | -- |
| Management Firmware Version: | -- |
| Workload Version: | SSJ 0.23 |
| Director Location: | Controller |
| Other Software: | None |
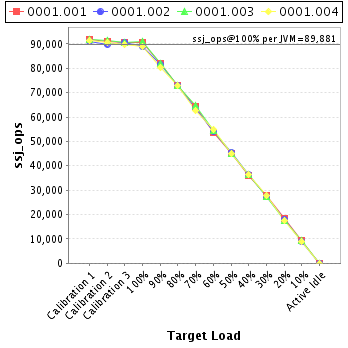
| JVM Instance | ssj_ops@100% |
|---|---|
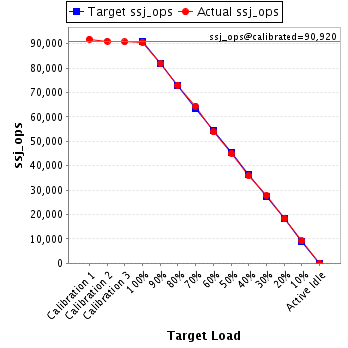
| 0001.001 | 90,621 |
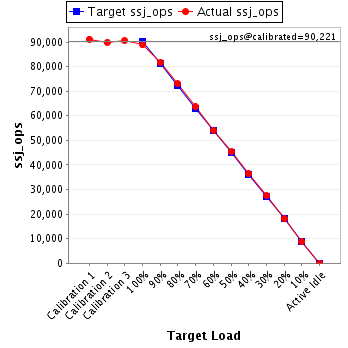
| 0001.002 | 88,822 |
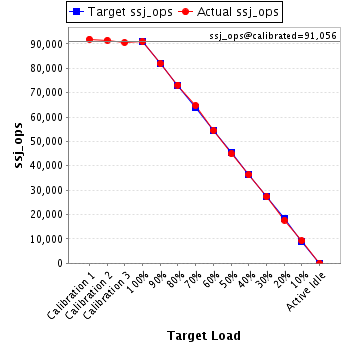
| 0001.003 | 91,069 |
| 0001.004 | 89,011 |
| ssj_ops@100% | 359,523 |
| ssj_ops@100% per JVM | 89,881 |
| Target Load | Actual Load | ssj_ops | |
|---|---|---|---|
| Target | Actual | ||
| Calibration 1 | 91,896 | ||
| Calibration 2 | 91,105 | ||
| Calibration 3 | 90,736 | ||
| ssj_ops@calibrated=90,920 | |||
| 100% | 99.7% | 90,920 | 90,621 |
| 90% | 90.2% | 81,828 | 81,976 |
| 80% | 80.2% | 72,736 | 72,962 |
| 70% | 70.9% | 63,644 | 64,470 |
| 60% | 59.2% | 54,552 | 53,839 |
| 50% | 49.6% | 45,460 | 45,078 |
| 40% | 39.6% | 36,368 | 35,996 |
| 30% | 30.6% | 27,276 | 27,823 |
| 20% | 20.1% | 18,184 | 18,249 |
| 10% | 10.1% | 9,092 | 9,174 |
| Active Idle | 0 | 0 | |
| Target Load | Actual Load | ssj_ops | |
|---|---|---|---|
| Target | Actual | ||
| Calibration 1 | 91,176 | ||
| Calibration 2 | 89,847 | ||
| Calibration 3 | 90,595 | ||
| ssj_ops@calibrated=90,221 | |||
| 100% | 98.4% | 90,221 | 88,822 |
| 90% | 90.5% | 81,199 | 81,680 |
| 80% | 80.9% | 72,177 | 72,961 |
| 70% | 70.5% | 63,155 | 63,629 |
| 60% | 60.0% | 54,133 | 54,124 |
| 50% | 50.2% | 45,111 | 45,327 |
| 40% | 40.3% | 36,088 | 36,329 |
| 30% | 30.4% | 27,066 | 27,411 |
| 20% | 20.0% | 18,044 | 18,038 |
| 10% | 9.7% | 9,022 | 8,760 |
| Active Idle | 0 | 0 | |
| Target Load | Actual Load | ssj_ops | |
|---|---|---|---|
| Target | Actual | ||
| Calibration 1 | 91,952 | ||
| Calibration 2 | 91,520 | ||
| Calibration 3 | 90,593 | ||
| ssj_ops@calibrated=91,056 | |||
| 100% | 100.0% | 91,056 | 91,069 |
| 90% | 89.9% | 81,951 | 81,894 |
| 80% | 80.3% | 72,845 | 73,125 |
| 70% | 71.1% | 63,740 | 64,746 |
| 60% | 59.9% | 54,634 | 54,526 |
| 50% | 49.3% | 45,528 | 44,919 |
| 40% | 39.9% | 36,423 | 36,309 |
| 30% | 30.0% | 27,317 | 27,315 |
| 20% | 19.4% | 18,211 | 17,688 |
| 10% | 10.2% | 9,106 | 9,266 |
| Active Idle | 0 | 0 | |
| Target Load | Actual Load | ssj_ops | |
|---|---|---|---|
| Target | Actual | ||
| Calibration 1 | 91,447 | ||
| Calibration 2 | 90,611 | ||
| Calibration 3 | 89,816 | ||
| ssj_ops@calibrated=90,213 | |||
| 100% | 98.7% | 90,213 | 89,011 |
| 90% | 89.1% | 81,192 | 80,381 |
| 80% | 80.9% | 72,171 | 72,942 |
| 70% | 69.5% | 63,149 | 62,667 |
| 60% | 60.7% | 54,128 | 54,733 |
| 50% | 49.8% | 45,107 | 44,938 |
| 40% | 40.4% | 36,085 | 36,446 |
| 30% | 30.6% | 27,064 | 27,624 |
| 20% | 19.3% | 18,043 | 17,434 |
| 10% | 9.8% | 9,021 | 8,870 |
| Active Idle | 0 | 0 | |
