SPECpower_ssj2008
Host '0001' Performance Report
Copyright © 2007-2008 Standard Performance Evaluation Corporation
| Inspur(Beijing) Electronic Information Industry Co., Ltd NF290D2 (2.5 GHz, Intel Xeon Processor L5420) | ssj_ops@100% = 262,599 ssj_ops@100% per JVM = 131,299 |
||||
| Test Sponsor: | Inspur(Beijing) Electronic Information Industry Co., Ltd | SPEC License #: | 3358 | Test Method: | Single Node |
| Tested By: | Inspur(Beijing) Electronic Information Industry Co., Ltd | Test Location: | Ji'nan, Shandong, China | Test Date: | Mar 12, 2008 |
| Hardware Availability: | Mar-2008 | Software Availability: | Feb-2008 | Publication: | Mar 26, 2008 |
| System Source: | Single Supplier | System Designation: | Server | Power Provisioning: | Line-powered |
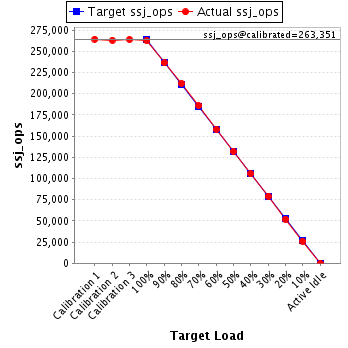
| Target Load | Actual Load | ssj_ops | |
|---|---|---|---|
| Target | Actual | ||
| Calibration 1 | 264,218 | ||
| Calibration 2 | 262,920 | ||
| Calibration 3 | 263,781 | ||
| ssj_ops@calibrated=263,351 | |||
| 100% | 99.7% | 263,351 | 262,599 |
| 90% | 89.7% | 237,015 | 236,310 |
| 80% | 80.5% | 210,680 | 212,049 |
| 70% | 70.5% | 184,345 | 185,731 |
| 60% | 60.0% | 158,010 | 158,075 |
| 50% | 50.1% | 131,675 | 132,049 |
| 40% | 40.0% | 105,340 | 105,433 |
| 30% | 30.1% | 79,005 | 79,143 |
| 20% | 19.8% | 52,670 | 52,182 |
| 10% | 9.9% | 26,335 | 26,074 |
| Active Idle | 0 | 0 | |
| Set Identifier: | sut |
| Set Description: | NF290D2 (2.5 GHz, Intel Xeon Processor L5420) |
| # of Identical Nodes: | 1 |
| Comment: | None |
| Hardware | |
|---|---|
| Hardware Vendor: | Inspur(Beijing) Electronic Information Industry Co., Ltd |
| Model: | NF290D2 (2.5 GHz, Intel Xeon Processor L5420) |
| Form Factor: | -- |
| CPU Name: | Intel Xeon L5420 |
| CPU Characteristics: | 2.5 GHz, 2x6 MB L2 shared, 1333 MHz system bus |
| CPU Frequency (MHz): | 2500 |
| CPU(s) Enabled: | 8 cores, 2 chips, 4 cores/chip |
| Hardware Threads: | 8 (1 / core) |
| CPU(s) Orderable: | 1,2 |
| Primary Cache: | 32KB I + 32KB D on chip per core |
| Secondary Cache: | 12 MB I+D on chip per chip, 6 MB shared/2 cores |
| Tertiary Cache: | None |
| Other Cache: | None |
| Memory Amount (GB): | 8 |
| # and size of DIMM: | 2 x 4GB |
| Memory Details: | PC2-5300P CL5; slots 1-2 populated; |
| Power Supply Quantity and Rating (W): | 1 x 500 |
| Power Supply Details: | INSPUR # S_P2G-5500V_2U_Ro |
| Disk Drive: | 1 x 160GB 7.2K RPM, 3.5" SATA HDD |
| Disk Controller: | Integrated SATA controller |
| # and type of Network Interface Cards (NICs) Installed: | 2 x Onboard Gigabit |
| NICs Enabled in Firmware / OS / Connected: | 2/2/1 |
| Network Speed (Mbit): | 1000 |
| Keyboard: | PS2 |
| Mouse: | PS2 |
| Monitor: | Yes |
| Optical Drives: | No |
| Other Hardware: | None |
| Software | |
|---|---|
| Power Management: | Enabled (Server Balanced Power and Performance) |
| Operating System (OS): | Microsoft Windows Server 2003 Enterprise x64 Edition Service Pack 2 |
| OS Version: | SP2 (64-bit) |
| Filesystem: | NTFS |
| JVM Vendor: | BEA Systems, Inc. |
| JVM Version: | BEA JRockit(R) (build R27.5.0-110-94909-1.6.0_03-20080204-1558-windows-x86_64, compiled mode) |
| JVM Command-line Options: | -Xms3500m -Xmx3500m -Xns3100m -XXaggressive -XXlargePages -XXthroughputCompaction -XXcallprofiling -XXlazyUnlocking -Xgc:genpar -XXgcthreads:4 -XXtlasize:min=12k,preferred=1024k |
| JVM Affinity: | start /affinity [0F,F0] |
| JVM Instances: | 4 |
| JVM Initial Heap (MB): | 3500 |
| JVM Maximum Heap (MB): | 3500 |
| JVM Address Bits: | 64 |
| Boot Firmware Version: | -- |
| Management Firmware Version: | -- |
| Workload Version: | SSJ 1.1 |
| Director Location: | Controller |
| Other Software: | None |
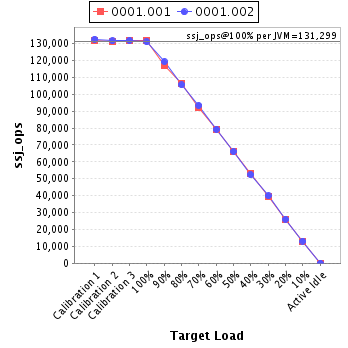
| JVM Instance | ssj_ops@100% |
|---|---|
| 0001.001 | 131,652 |
| 0001.002 | 130,947 |
| ssj_ops@100% | 262,599 |
| ssj_ops@100% per JVM | 131,299 |
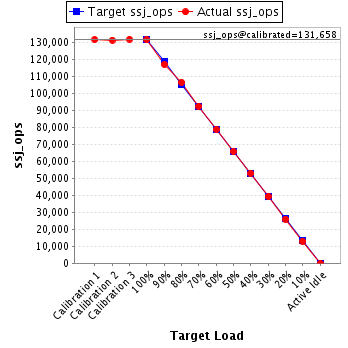
| Target Load | Actual Load | ssj_ops | |
|---|---|---|---|
| Target | Actual | ||
| Calibration 1 | 131,656 | ||
| Calibration 2 | 131,386 | ||
| Calibration 3 | 131,929 | ||
| ssj_ops@calibrated=131,658 | |||
| 100% | 100.0% | 131,658 | 131,652 |
| 90% | 88.9% | 118,492 | 117,082 |
| 80% | 80.9% | 105,326 | 106,561 |
| 70% | 70.2% | 92,160 | 92,400 |
| 60% | 59.9% | 78,995 | 78,852 |
| 50% | 50.1% | 65,829 | 65,901 |
| 40% | 40.3% | 52,663 | 53,038 |
| 30% | 29.8% | 39,497 | 39,300 |
| 20% | 19.8% | 26,332 | 26,046 |
| 10% | 9.8% | 13,166 | 12,937 |
| Active Idle | 0 | 0 | |
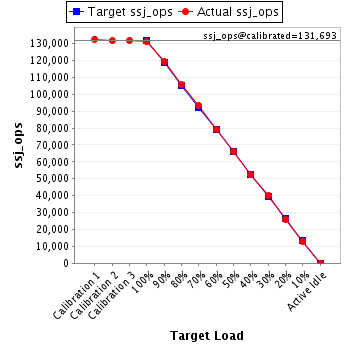
| Target Load | Actual Load | ssj_ops | |
|---|---|---|---|
| Target | Actual | ||
| Calibration 1 | 132,563 | ||
| Calibration 2 | 131,535 | ||
| Calibration 3 | 131,851 | ||
| ssj_ops@calibrated=131,693 | |||
| 100% | 99.4% | 131,693 | 130,947 |
| 90% | 90.5% | 118,524 | 119,228 |
| 80% | 80.1% | 105,354 | 105,489 |
| 70% | 70.9% | 92,185 | 93,331 |
| 60% | 60.2% | 79,016 | 79,223 |
| 50% | 50.2% | 65,847 | 66,147 |
| 40% | 39.8% | 52,677 | 52,395 |
| 30% | 30.3% | 39,508 | 39,843 |
| 20% | 19.8% | 26,339 | 26,136 |
| 10% | 10.0% | 13,169 | 13,137 |
| Active Idle | 0 | 0 | |